Reading depth
- 1. The BOM Revision — What ChangedThe rack price doubled, but within it the space memory takes has widened 2.7x.Jump to section
- 2. The $2.0M Memory Bill — HBM4 + LPDDR5XThe memory surge is a composition change. HBM4's 20.7 TB plus Vera CPU's 54 TB LPDDR5X, as LPDDR enters data centers, pushing memory's share to 25.6%.Jump to section
- 3. Evolution of the Proposition — From HBM 15.5% to Memory 25.6%From HBM-only analysis to memory-wide analysis — the resolution of the diagnostic tool just went up.Jump to section
- 4. Allocation of the $2.0M Memory BillExpanded to a memory thesis, the picture shifts from SK-heavy to two-maker balance: HBM4 dual, LPDDR5X Samsung-led, both taking most of the $2.0M bill.Jump to section
- 5. The Path of Progress — As the BOM Ceiling Rises, Progress FallsThe largest gap between progress and valuation sits with memory.Jump to section
- 6. The Hidden Bottleneck — Substrate and Component EcosystemPCB, MLCC, ABF are under 2% of BOM, but their growth trails only memory, and without them the other 98% stops. BOM share and bottleneck strength differ.Jump to section
- 7. Market Context — May 21, 2026One day in which the market priced the BOM proposition — yet +8.42% being a record gain also signals near-term overheating.Jump to section
- 8. Conclusion — The Place Memory TookMemory is now the firm second axis after GPU. The BOM ceiling widens the memory industry's revenue ceiling 2.7x, and HBM4 plus LPDDR5X benefit both makers.Jump to section
1. The BOM Revision — What Changed
Start with the new data exactly as Morgan Stanley estimated it (April 2026).
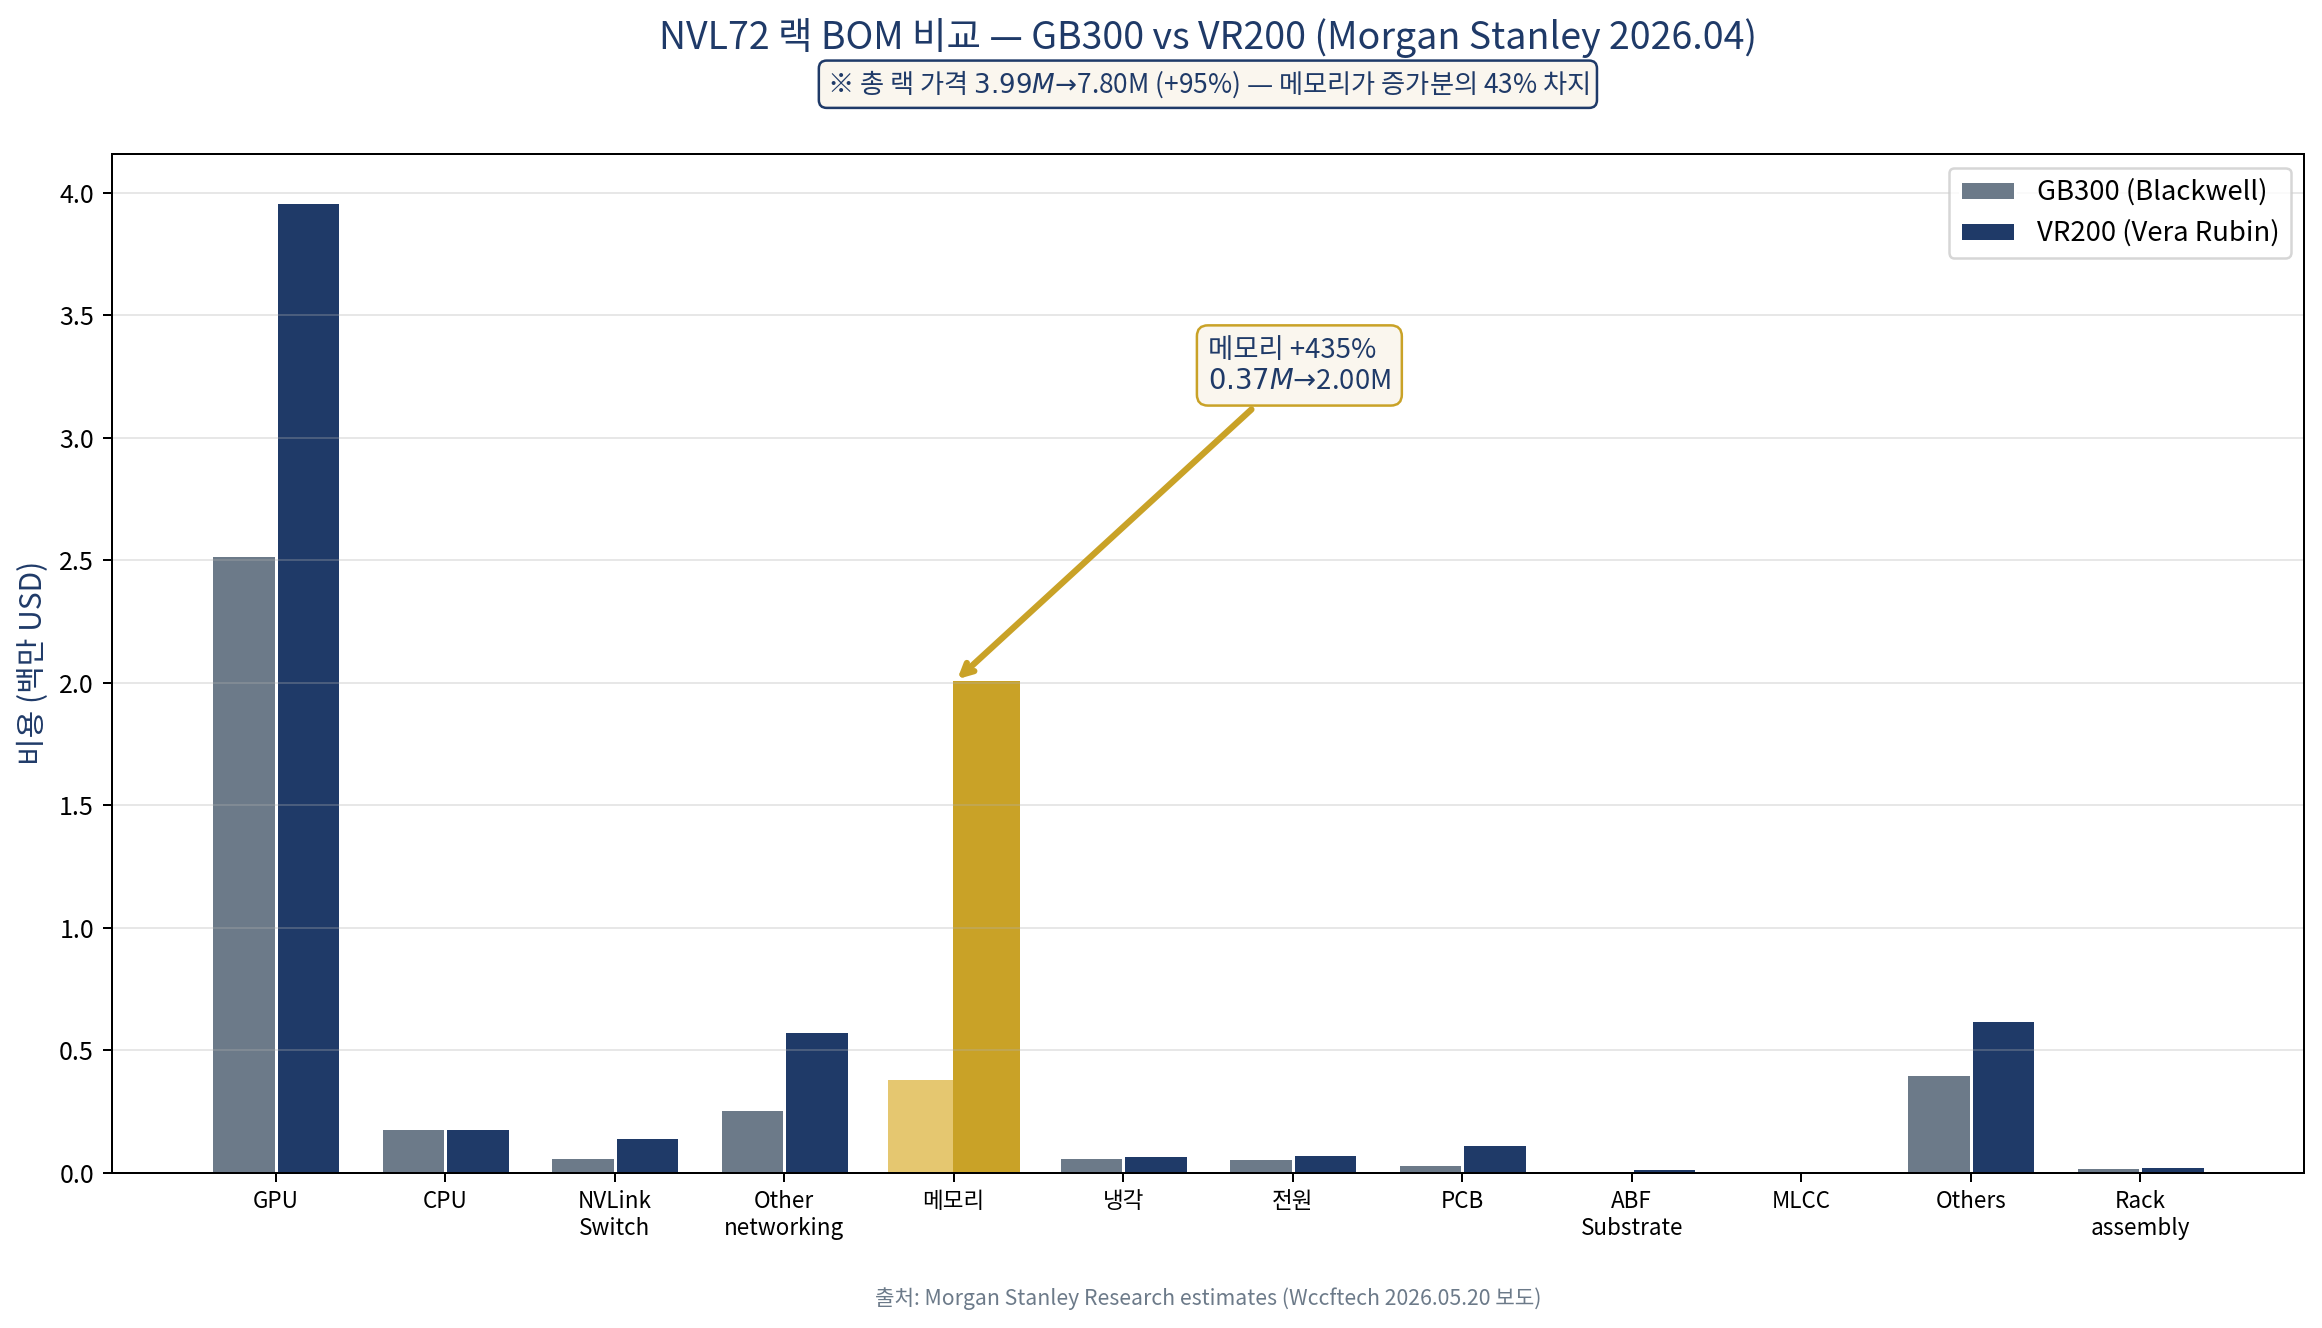
<Chart 1> NVL72 rack BOM comparison — GB300 vs VR200
Item-by-item change
GPU rose from $2,520,000 to $3,960,000 — a 57% increase, about $55,000 per GPU. It remains the most expensive single line item. But its share of the rack fell from 63.1% to 50.7%.
Memory is the lead story of this revision. From $373,939 to $2,001,600 — +435%. Of the $3.8M total rack increase, memory accounted for $1.63M, or 43% — more than the GPU's $1.44M increase.
Networking also surged. NVLink Switch +122%, other networking +121%. PCB +233%, MLCC +182%, substrate +82%. As electrical complexity exploded, substrate and passive component costs jumped together.
CPU was flat at $180,000. Cooling rose only 12% and power 32%. These are the items whose shares shrank.
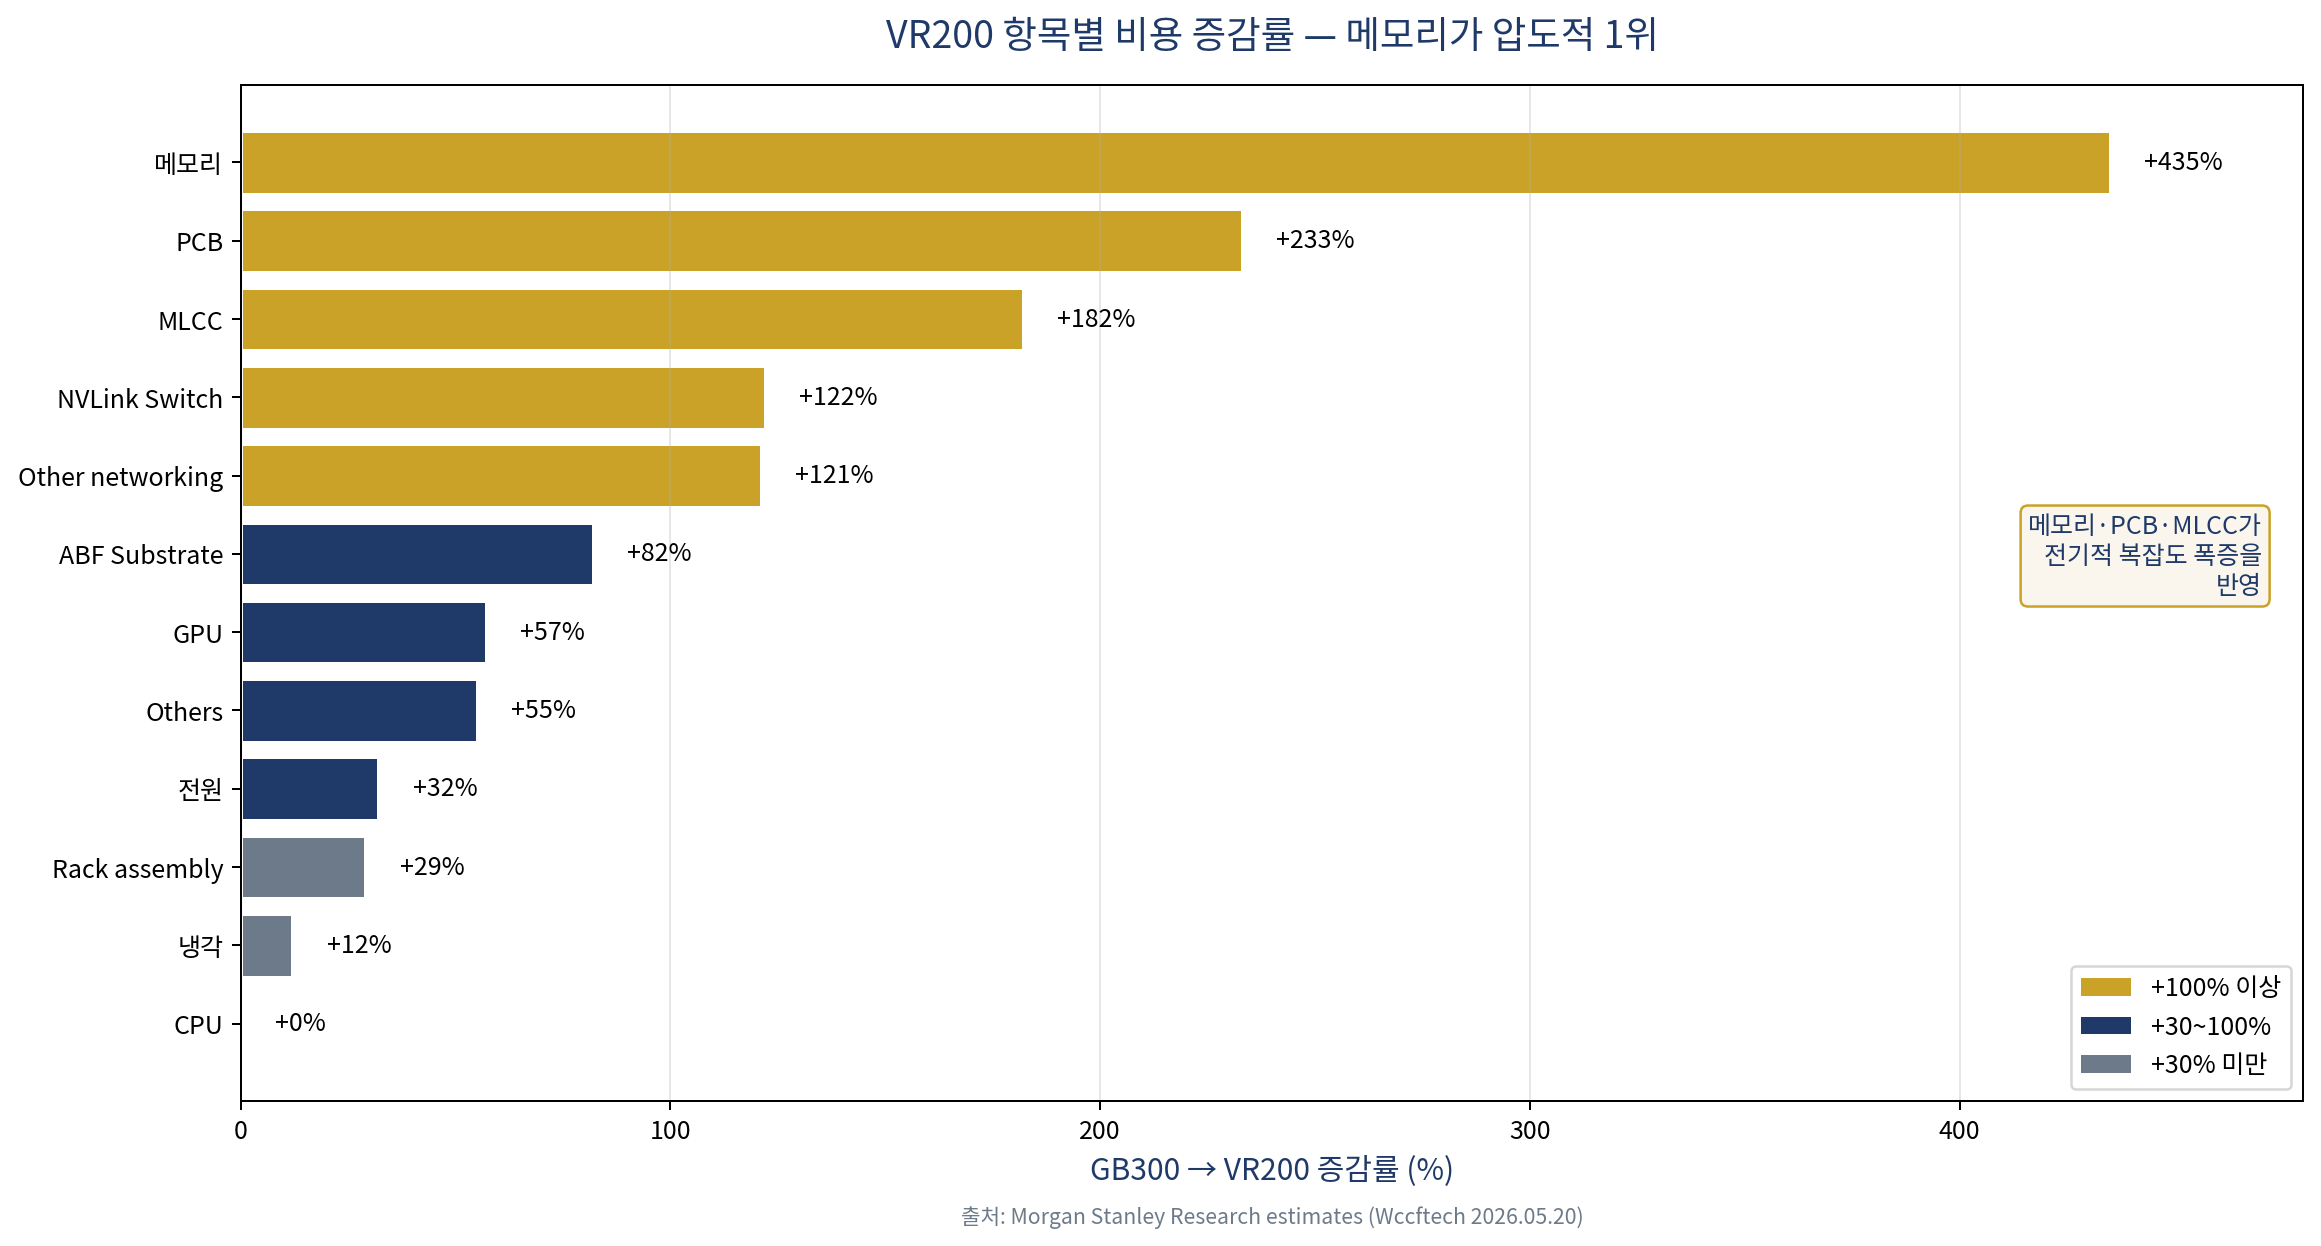
<Chart 2> VR200 cost change rate by item
Total and shares
VR200 NVL72 rack total: $7,803,148 — a 95% increase from GB300's $3,994,551. Effectively doubled.
The share structure shifted. GPU 50.7%, memory 25.6%, others 8.0%, networking 9.2%, CPU 2.3%, remainder 4.2%. GPU sits just above half; memory occupies a quarter.
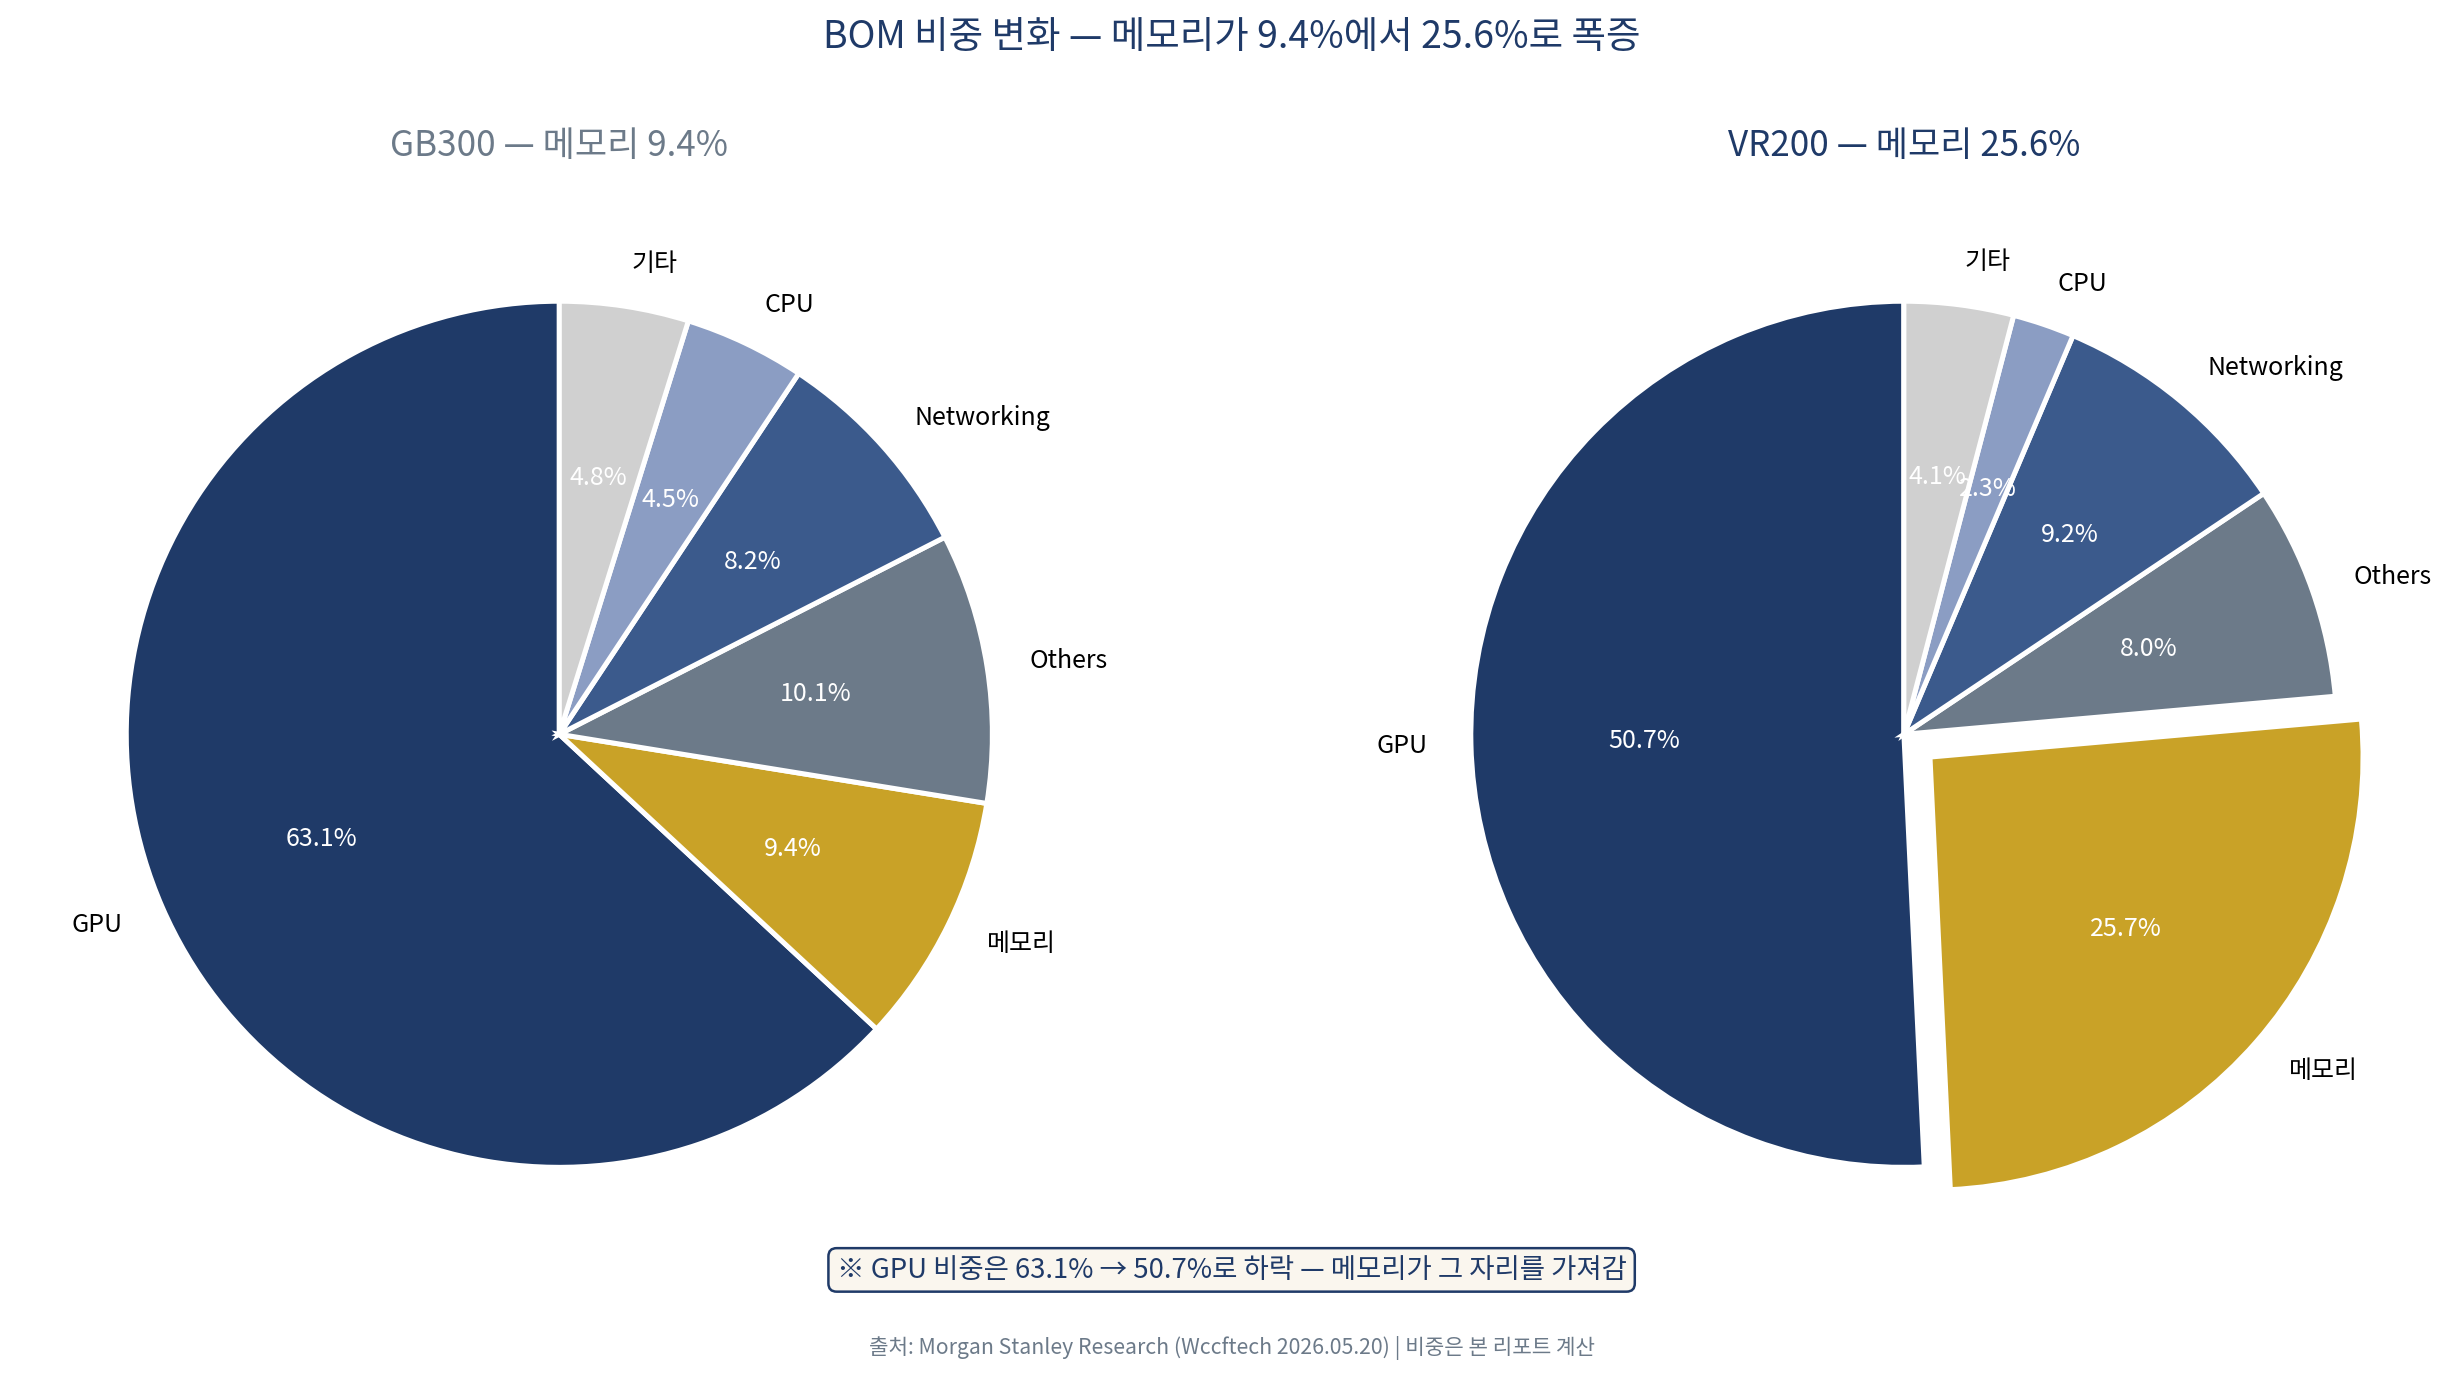
<Chart 3> BOM share change — memory from 9.4% to 25.6%
The rack price doubled, but within it the space memory takes has widened 2.7x.