AI didn't kill the HDD — it revived it. The cold tier's lowest-cost-per-terabyte requirement converged HDDs onto the single nearline market, and supply discipline that refuses to add units handed pricing power to the drive makers. Growth is qualitatively different — volume and price at once — and areal density (HAMR) is margin.
Reader's Brief — 30-second TL;DR
Advanced
Why Now
As Western Digital's prior-quarter revenue of +45% decomposed into volume +34% × price +9%, nearline capacity sold out through 2027, and Seagate began shipping production HAMR (Mozaic 4, up to 44TB) alone, 'the HDD AI revived' emerged as an investment axis.
Winners ?? Losers
Drives — Seagate (HAMR areal-density leader, margin expansion) · Western Digital (price discipline, pure-HDD transition). Merchant-bottleneck pick-and-shovel — Hoya (sole global glass-substrate supply, direct HAMR upside) · Nidec (~80% of spindle motors). Offsets — QLC NAND substitution speed, hyperscale capex cycle, and a valuation already re-rated ~7x.
The HDD market splits by use into nearline (high-capacity enterprise), enterprise mission-critical, consumer/client, and surveillance/NAS (VIA). The growth axis is converging on the single nearline segment. Consumer is exiting fast to SSD and accounts for about 32% by units but contributes little in exabytes or revenue; surveillance/NAS keeps stable demand thanks to its fit for sequential writes.
By form factor, 3.5-inch drives took about 65.6% of 2025 revenue and lead the market with ~9.3% annual growth, because hyperscale operators prioritize per-rack capacity . Average drive capacity rose from 3.6TB in 2023 to 4.2TB in 2025, and helium-sealed drives make up about 58% of enterprise shipments.
The macro backdrop is data explosion. Global data creation topped 120 zettabytes in 2023, and about 62% of enterprise storage still relies on HDDs for cost efficiency and scalability. By region, Asia-Pacific leads with ~45% of shipments — Thailand is the key manufacturing hub — while China and Japan drive regional demand through hyperscale expansion. North America is ~25%, where hyperscale operator demand concentrates.
Segment
Share
Note
(exabytes)
~68%+
Growth axis · ~93% of revenue by 2027
Consumer (units)
~32%
Exiting to SSD, minimal exabyte contribution
Surveillance/NAS (units)
~14%
Fits sequential writes, stable demand
3.5-inch (revenue)
~65.6%
~9.3% CAGR, per-rack density edge
Asia-Pacific (shipments)
~45%
Manufacturing hub (Thailand), CN/JP hyperscale
North America (shipments)
~25%
Hyperscale demand concentration
Segment
Nearline (exabytes)
Share
~68%+
Note
Growth axis · ~93% of revenue by 2027
Segment
Consumer (units)
Share
~32%
Note
Exiting to SSD, minimal exabyte contribution
Segment
Surveillance/NAS (units)
Share
~14%
Note
Fits sequential writes, stable demand
Segment
3.5-inch (revenue)
Share
~65.6%
Note
~9.3% CAGR, per-rack density edge
Segment
Asia-Pacific (shipments)
Share
~45%
Note
Manufacturing hub (Thailand), CN/JP hyperscale
Segment
North America (shipments)
Share
~25%
Note
Hyperscale demand concentration
1.2 Market size — TAM by source
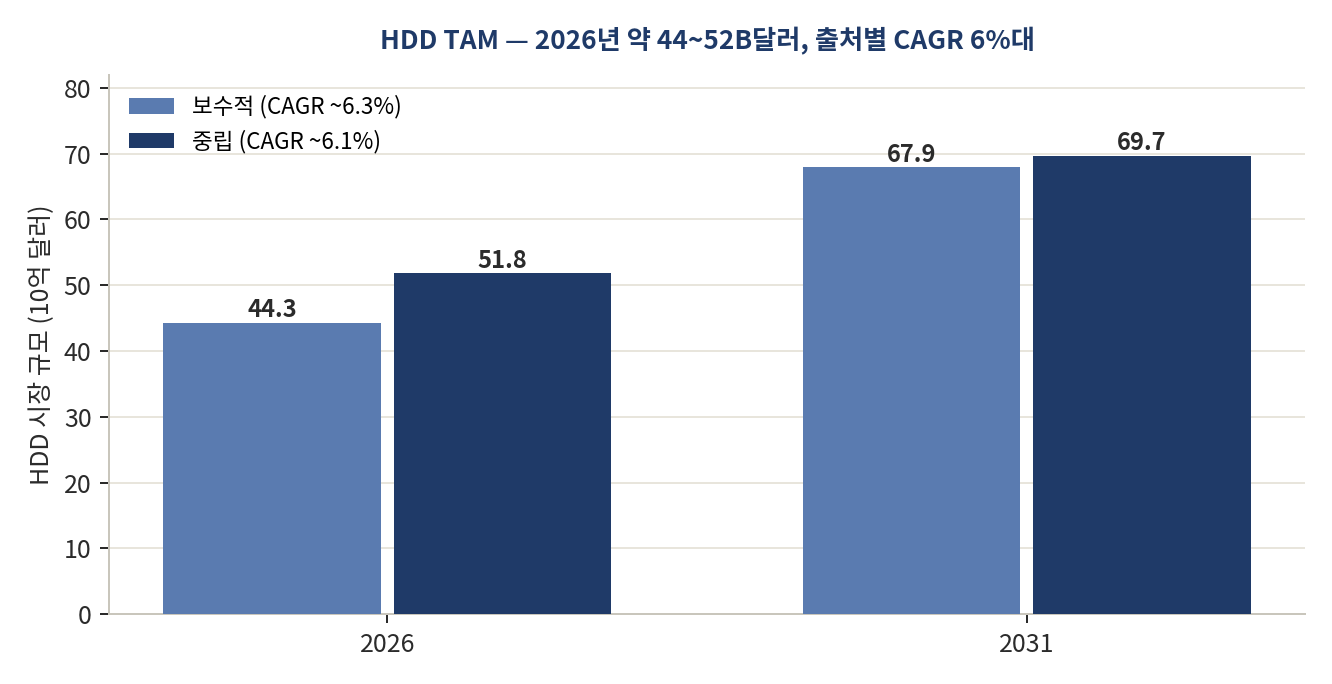
HDD market size for 2026 ranges roughly $44.3–51.8 billion, varying by source. The conservative estimate (Persistence) runs from ~$44.3B in 2026 to $67.9B in 2033 (6.3% CAGR); the neutral estimate (Mordor) from ~$51.8B in 2026 to $69.7B in 2031 (6.1% CAGR). On a quarterly basis, HDD supplier revenue has stabilized above $6 billion per quarter through early 2026 since the 2024 recovery.
The key point is that the growth driver is not unit volume. Global shipments in 2025 are effectively flat around 278 million units, yet exabytes and revenue grow fast. In other words, market expansion comes from rising per-drive capacity and — and that structure is the foundation of pricing power.
1.3 Convergence to nearline
Nearline already holds over ~68% of HDD exabytes and is projected to reach ~93% of HDD revenue by 2027. The number of hyperscale data centers is forecast to roughly triple from 1,136 at end-2024 to 2030, with storage accounting for about one-fifth of large cloud operators' capex. The U.S. holds about 54% of installed hyperscale capacity, where power constraints favor HDDs with better terabytes-per-watt efficiency.
HDD TAM matters less for its absolute size (~$44–52B) than for the quality of its growth. The market is converging on the single nearline segment, and the expansion driver is capacity and price, not units. The analytical baseline must be exabytes and ASP — not unit shipments.
Full access requires a free account
Sign in with Google to unlock the full body of every free report instantly.
This site runs on ads — the tier system rewards community contributions.
Comments
This report is provided for informational purposes only and does not constitute a recommendation to buy or sell any financial instrument. Investment decisions should be made based on your own judgment and responsibility. The analysis and opinions contained herein are based on information available at the time of writing and are subject to change.