NVIDIA — Preview of the August 2026 Earnings Release
Reading the fiscal 2027 second-quarter release through customer free cash flow, the 500 billion dollar funding structure, inventory and customer concentration
Beating the estimate no longer moves the shares, and the variables that do sit outside the income statement. Customer free cash flow fell 89 percent in three quarters, the 500 billion dollar funding structure followed, and that structure moves customer credit risk onto NVIDIA's balance sheet. The confirmed guarantee of 105 billion dollars equals 53.7 percent of equity, and the credit market has not yet priced the transfer.
Reader's Brief — 30-second TL;DR
Advanced
Why Now
Winners ?? Losers
Watch For
Reading depth
The Record of Next-Day Reactions
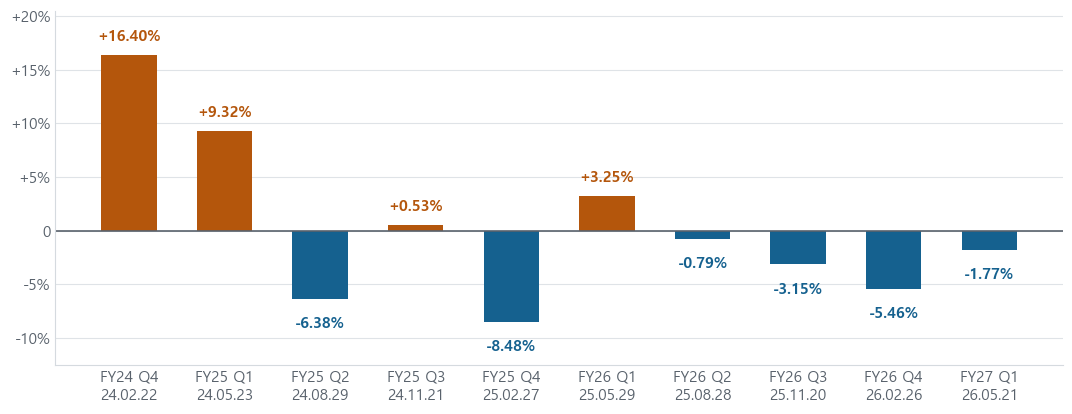
Start with the record reactions. Results land after the close, so the market's verdict shows up in the next session's close. Laying out all ten quarters since 2024 produces a clear break.
Next-day closing move after each quarterly report, all ten quarters from February 2024 to May 2026
Chart 1. Next-day closing move after each report — all ten quarters since 2024
The February and May 2024 reports were followed by gains 16.40 percent and 9.32 percent. After that the pattern changes. Across the eight quarters since August 2024 there were only two gains and the average was negative 2.78 percent. Over the last five quarters, four were down.
Report date
Fiscal quarter
Next day
5 sessions
20 sessions
2024-02-21
FY24 Q4
+16.40%
+15.10%
+33.94%
2024-05-22
FY25 Q1
+9.32%
+16.38%
+33.30%
2024-08-28
FY25 Q2
-6.38%
-14.65%
-1.25%
2024-11-20
FY25 Q3
+0.53%
-7.23%
-10.43%
2025-02-26
FY25 Q4
-8.48%
-10.65%
-13.35%
2025-05-28
FY26 Q1
+3.25%
+5.27%
+14.99%
2025-08-27
FY26 Q2
-0.79%
-5.47%
-2.15%
2025-11-19
FY26 Q3
-3.15%
-3.36%
-6.64%
2026-02-25
FY26 Q4
-5.46%
-6.40%
-8.63%
2026-05-20
FY27 Q1
-1.77%
-4.13%
-5.72%
Report date
2024-02-21
Fiscal quarter
FY24 Q4
Next day
+16.40%
5 sessions
+15.10%
20 sessions
+33.94%
Report date
2024-05-22
Fiscal quarter
FY25 Q1
Next day
+9.32%
5 sessions
+16.38%
20 sessions
+33.30%
Report date
2024-08-28
Fiscal quarter
FY25 Q2
Next day
-6.38%
5 sessions
-14.65%
20 sessions
-1.25%
Report date
2024-11-20
Fiscal quarter
FY25 Q3
Next day
+0.53%
5 sessions
-7.23%
20 sessions
-10.43%
Report date
2025-02-26
Fiscal quarter
FY25 Q4
Next day
-8.48%
5 sessions
-10.65%
20 sessions
-13.35%
Report date
2025-05-28
Fiscal quarter
FY26 Q1
Next day
+3.25%
5 sessions
+5.27%
20 sessions
+14.99%
Report date
2025-08-27
Fiscal quarter
FY26 Q2
Next day
-0.79%
5 sessions
-5.47%
20 sessions
-2.15%
Report date
2025-11-19
Fiscal quarter
FY26 Q3
Next day
-3.15%
5 sessions
-3.36%
20 sessions
-6.64%
Report date
2026-02-25
Fiscal quarter
FY26 Q4
Next day
-5.46%
5 sessions
-6.40%
20 sessions
-8.63%
Report date
2026-05-20
Fiscal quarter
FY27 Q1
Next day
-1.77%
5 sessions
-4.13%
20 sessions
-5.72%
Cumulative moves measured from the closing price on the report date.
The following weeks were worse than the first day. Four of the last five quarters were negative twenty sessions out. The initial reaction was not reversed; it continued in the same direction.
The results kept beating
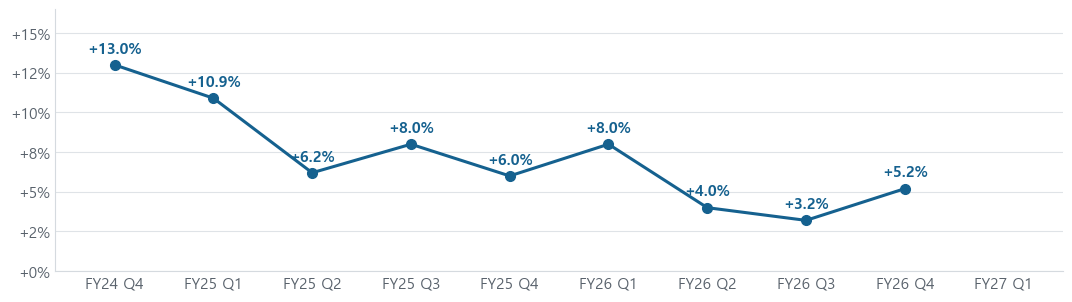
Over the same period the reported numbers never fell short.
Earnings per share versus consensus estimate, by quarter
Chart 2. Amount by which earnings per share exceeded the estimate — all ten quarters above consensus
The beat narrowed from 13.0 percent to the low single digits. Some narrowing is natural as the base grows. The issue is that the share-price reaction deteriorated faster than the beat narrowed.
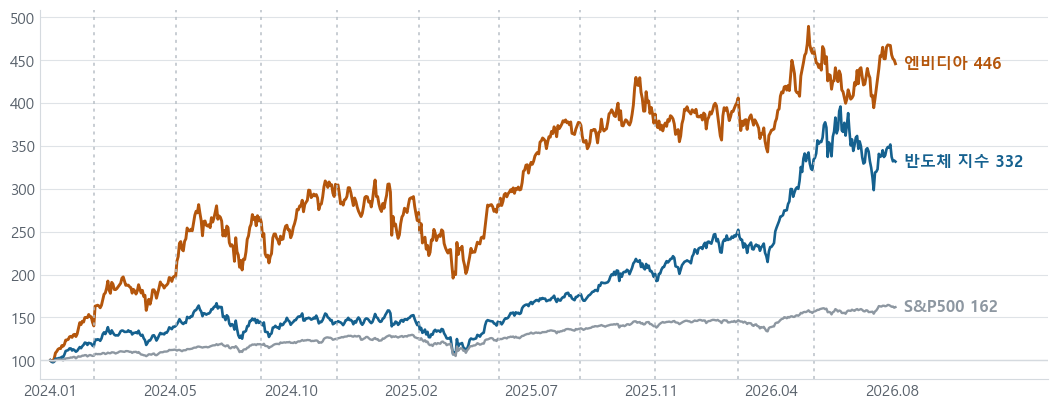
Overlaying the report dates on the price path makes the change plainer.
Indexed price path with January 2, 2024 set to 100. Dotted lines mark report dates
Chart 3. Price path — January 2, 2024 = 100, dotted lines mark report dates
Since the start of 2024 NVIDIA is up 345.8 percent. The semiconductor index is up 231.7 percent and the S&P 500 is up 62.0 percent. The outperformance is intact. Since August 2024, however, report dates have more often marked the start of a pullback. The shares currently sit 8.9 percent below their recent high.
Ten beats in a row produced six lower closes out of eight.
Full access requires a free account
Sign in with Google to unlock the full body of every free report instantly.
This site runs on ads — the tier system rewards community contributions.
Comments
This report is provided for informational purposes only and does not constitute a recommendation to buy or sell any financial instrument. Investment decisions should be made based on your own judgment and responsibility. The analysis and opinions contained herein are based on information available at the time of writing and are subject to change.