Testing What Drove the Bitcoin and Ethereum Surge — Volume, ETFs, Stablecoins
Three explanations for a three-session gain of 20.3 percent in bitcoin and 23.7 percent in Ethereum, tested against raw data and set against the 32 comparable surges since 2017
The volume surge and ETF inflows are confirmed; the stablecoin route is not. What produced the move is the Treasury's expanded long-dated buyback together with the war, oil prices, rising long yields and the divergence between the Federal Reserve and the Treasury that made it necessary. The advance was built on spot buying and forced liquidations rather than leverage, and Ethereum reflected the move transmitted from bitcoin at 1.2 times the size.
Reader's Brief — 30-second TL;DR
Advanced
Why Now
Winners ?? Losers
Watch For
Reading depth
Testing the Three Explanations
Judging a volume surge in dollar terms produces the wrong answer. When price rises 20 percent, the same quantity changing hands shows up as 20 percent more dollar turnover. Every volume figure here is counted in coins actually traded.
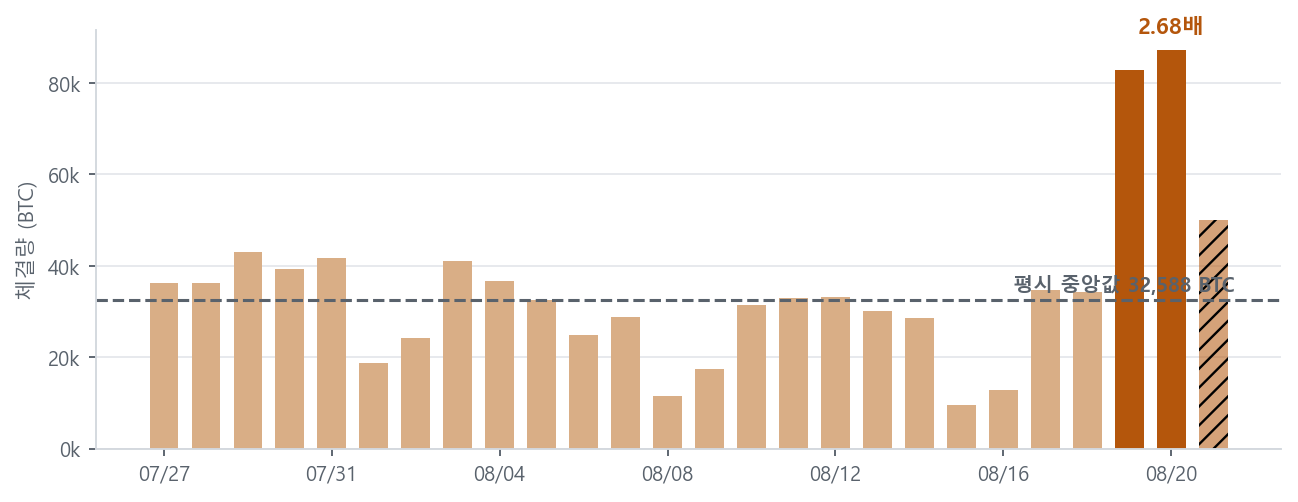
Combined bitcoin spot volume across Binance, Bybit, OKX, Kraken, Coinbase and Upbit rose from a normal median of 32,588 coins to 87,271 coins on 20 August. That is 2.68 times normal. It cannot be dismissed as one venue's outlier, because all six moved at the same time.
Combined daily bitcoin spot volume across six exchanges, measured in coins. The dashed line is the median from 27 July to 18 August
The order of the multiples carries information. Venues that take money straight from bank accounts sit at the top.
Exchange
Settlement currency
Normal median
Peak day
Multiple
Kraken
US dollar
1,216
5,973
4.91x
Upbit
Korean won
553
2,439
4.41x
OKX
Tether
4,153
15,408
3.71x
Binance
Tether
12,743
35,905
2.82x
Coinbase
US dollar
6,020
16,918
2.81x
Bybit
Tether
6,843
14,077
2.06x
Exchange
Kraken
Settlement currency
US dollar
Normal median
1,216
Peak day
5,973
Multiple
4.91x
Exchange
Upbit
Settlement currency
Korean won
Normal median
553
Peak day
2,439
Multiple
4.41x
Exchange
OKX
Settlement currency
Tether
Normal median
4,153
Peak day
15,408
Multiple
3.71x
Exchange
Binance
Settlement currency
Tether
Normal median
12,743
Peak day
35,905
Multiple
2.82x
Exchange
Coinbase
Settlement currency
US dollar
Normal median
6,020
Peak day
16,918
Multiple
2.81x
Exchange
Bybit
Settlement currency
Tether
Normal median
6,843
Peak day
14,077
Multiple
2.06x
Kraken and Upbit, both settling in fiat currency, grew more than the tether-settled venues. New money used the banking rail more heavily, which points the same way as the stablecoin finding below.
Upbit volume rose 4.41 times, but there is no basis for reading that as Korean net buying. The kimchi stands at -0.03 percent on a tether basis, effectively zero. The kimchi premium measures how much more expensive coins are on Korean exchanges than abroad, and it widens when Korean net buying is strong. Upbit's tether price in won is 1,378, which is 1.3 percent below the actual exchange of 1,396. Turnover rose in Korea without net buying pressure.
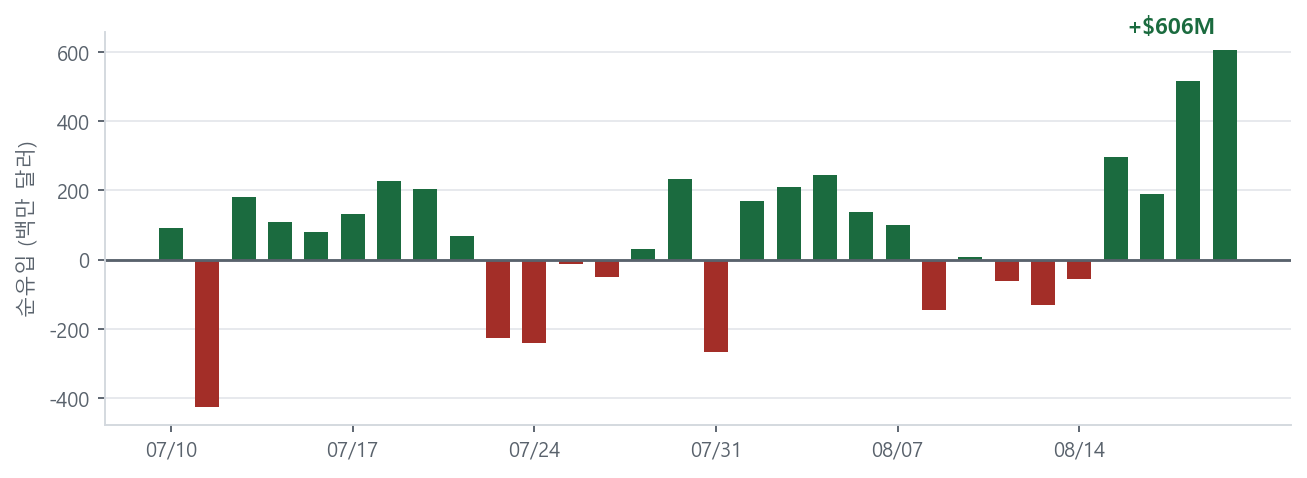
Net inflows into US-listed spot ETFs were positive for four consecutive sessions from 17 August. The daily figures were $297.5m, $189.3m, $517.2m and $606.3m, totalling $1,610.3m. Net inflow is newly created ETF shares minus redeemed shares, and a positive figure means managers bought that much bitcoin.
Combined daily net inflow across 11 US-listed spot bitcoin ETFs. The five sessions from 10 to 14 August were consecutive outflows, and the turn came on 17 August
The size only means something in rank terms. The $606.3m on 20 August ranks 47th of the 670 trading days since the January 2024 listing. The all-time daily average is $79.8m, so this was 7.6 times average. The last larger day was 1 May.
The monthly picture shows a clear turn. May saw $2,406m leave and June $4,510m, while July was nearly flat at $173m. August has taken in $2,090m through the 20th, with 77 percent of that arriving in the last four sessions.
Timing matters here. ETFs started buying on 17 August, and the announcement came on 19 August. ETF money changed direction before prices rose. Another gauge of US spot demand points the same way. The Coinbase premium measures how much higher the dollar price on Coinbase sits above the tether price on Binance. Pinned between -0.09 and -0.11 percent from late July through mid-August, it narrowed to -0.008 percent on 21 August.
The third claim is that progress on stablecoin regulation drew capital in. Stablecoins are cryptocurrencies pegged to a fiat currency such as the dollar and serve as a cash substitute in crypto trading. The test is simple. Check whether total supply grew. Issuance requires depositing actual dollars, so supply growth maps directly to outside money arriving.
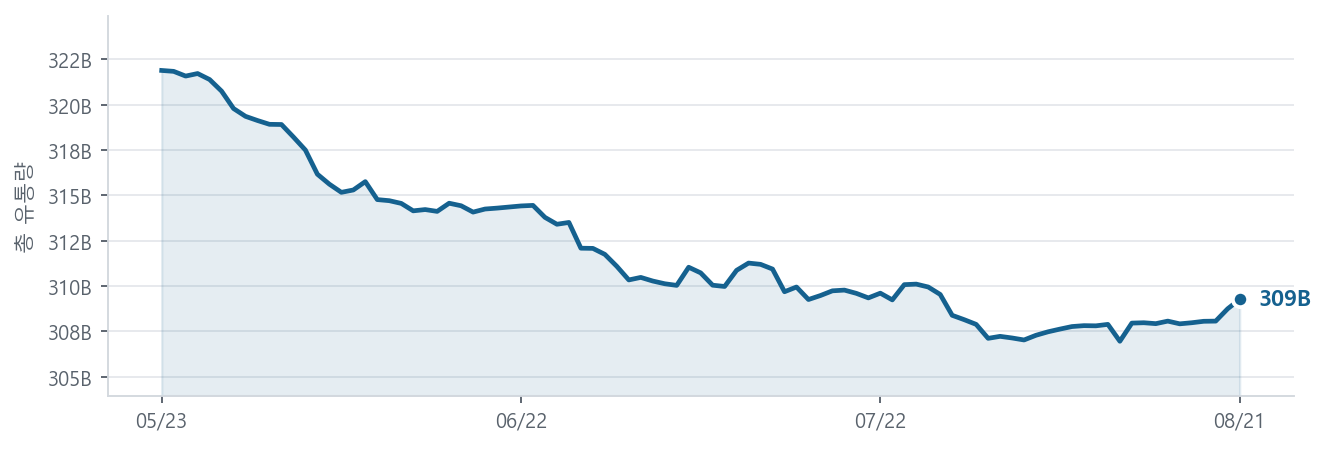
Total stablecoin supply across all tokens, in billions of dollars, over the last 90 days
Total supply fell 4.0 percent over 90 days and 0.1 percent over 30 days. Tether, used mainly by offshore retail traders, shrank by $1.19bn over the month. The one token that grew is USD Coin, up $940m over seven days, of which $580m came on 20 August alone.
Two things follow. First, the increase arrived on the second day after prices had already risen, so it cannot be the cause. Second, the token that grew sits inside US regulation and serves institutions. The capital route runs through the US regulated channel, which matches the ETF evidence.
Full access requires a free account
Sign in with Google to unlock the full body of every free report instantly.
This site runs on ads — the tier system rewards community contributions.
Comments
This report is provided for informational purposes only and does not constitute a recommendation to buy or sell any financial instrument. Investment decisions should be made based on your own judgment and responsibility. The analysis and opinions contained herein are based on information available at the time of writing and are subject to change.