A Comparative Study of Memory Cycles — Five Winters, and a Sixth Question
1996 DRAM, 2001 optical, the 2018 peak, the 2023 downturn, 2025 DeepSeek — re-verifying five collapses with one yardstick: no winter was ever caused by dying demand. The 2026 coordinate is a late upcycle overlapping a leading equity correction
In five winters, demand never died — supply outgrew demand, and equities broke one to two quarters before earnings. The memory correction since the June 2026 peak is the law repeating; the one open question is the downturn's depth — minus 50% or minus 15%.
Reader's Brief — 30-second TL;DR
Advanced
Why Now
SOX entered a bear market on July 17 at −20.2% from peak; KOSPI −28.5% (July 20 close). Samsung Electronics plunged on the day it reported a record KRW 89.4T quarterly operating profit, and DRAM contract-price growth is decelerating from +90%s in Q1 toward a +13-18% Q3 forecast.
Winners ?? Losers
Contract divergence makes the next downturn three separate winters — Micron, holding floors and take-or-pay, is best placed to prove an earnings floor; spot-exposed Samsung Electronics absorbs falling prices most directly; SK Hynix carries HBM supply-demand as an independent variable. CXMT, outside the cut discipline, is the 2027-28 supply variable.
Watch For
Jul 22 Alphabet capex guidance → week of Jul 29 Microsoft, Meta, SK Hynix results. HBM wafer share (18→22%), pre-groundbreaking contract-ratio disclosure, hyperscaler credit spreads, the server DRAM spot-fixed spread, CXMT yield and ramp execution
Reading depth
The Frame — Six Axes of Comparison
For cycle comparison to avoid becoming impressionistic, the axes must be fixed first. Six axes run through all five cases and the present.
1. The demand-supply gap
What sets prices is not the absolute size demand but the difference between bit-based demand growth and supply growth. DRAM bit demand has grown roughly 40% a year for four decades — and most DRAM makers were still driven out. Absolute demand growth saved no one; only the sign and size of the gap set the direction and magnitude of price.
2. Supply lead time and the capacity pipeline
Fab construction lead time creates the gap's time lag. It takes about three years from groundbreaking to volume production, so boom-time investment decisions arrive as supply after the boom has ended. When today's announced expansions turn into wafers, and where demand will be at that moment, is the second axis.
3. Price elasticity of demand
How much volume responds when prices fall determines the depth of the downturn. Elasticity near zero means price has no floor; above 1, falling prices actually grow industry revenue.
4. Sales contract structure
How much demand risk the supplier has transferred to buyers. The no-contract era, the era when contracts existed but counterparties vanished, the era of cancellable one-year deals, and the era of five-year take-or-pay produce entirely different P&L paths from the same oversupply. A contract's value is the product of its terms and the counterparty's credit — and counterparty hedging can make real enforceability weaker than nominal.
5. Funding structure and credit
Who builds capacity with what money. Chaebol debt, junk bonds and vendor (suppliers lending customers the money to buy), own cash flow, and customer prepayments draw completely different survival curves in a downturn. Funding structure determines less the depth of a downturn than its contagion path.
6. Competitive structure and new entry
What breaks supply discipline is always the marginal entrant. The fab rush of the 1990s, the three-player oligopoly since the 2010s, and the arrival of new Chinese supply produce different supply curves from the same demand environment.
Axis
Core question
Metric
1. Growth gap
How much faster did supply grow than demand
Bit-based supply vs. demand growth differential
2. Lead time
When does today's investment become supply
Groundbreaking-to-ramp lag, energization schedule
3. Price elasticity
How much does volume grow when price falls
Volume response to ASP, revenue direction
4. Contract structure
Who bears demand risk
Duration, caps/floors, prepayments, coverage
5. Funding and credit
Where does expansion money come from
Debt reliance, counterparty credit spreads
6. Competition
Is anyone outside the supply discipline
Entrant capacity, yield, funding
Axis
1. Growth gap
Core question
How much faster did supply grow than demand
Metric
Bit-based supply vs. demand growth differential
Axis
2. Lead time
Core question
When does today's investment become supply
Metric
Groundbreaking-to-ramp lag, energization schedule
Axis
3. Price elasticity
Core question
How much does volume grow when price falls
Metric
Volume response to ASP, revenue direction
Axis
4. Contract structure
Core question
Who bears demand risk
Metric
Duration, caps/floors, prepayments, coverage
Axis
5. Funding and credit
Core question
Where does expansion money come from
Metric
Debt reliance, counterparty credit spreads
Axis
6. Competition
Core question
Is anyone outside the supply discipline
Metric
Entrant capacity, yield, funding
On top of these six, a market-signal axis — by how many quarters share prices led earnings — is recorded for each case. That lead is the scale needed to read the current coordinates.
Cases I and II — 1996 DRAM and 2001 Optical Fiber: The Winter Before Contracts, and the Winter Contracts Could Not Stop
Case I. 1995-1998 — The Windows 95 supercycle and the first collapse
The 1993-1995 memory boom is the archetype of every supercycle since. Windows 95 and exploding PC adoption pushed DRAM demand ahead of supply; 4Mb and 16Mb DRAM spot and contract prices surged together, and leading suppliers' gross margins comfortably exceeded 50%. Samsung Electronics and Hyundai Electronics (now SK Hynix) rewrote record profits, and semiconductors accounted for around 13% of total Korean exports in 1995. The demand narrative was flawless. The internet was coming, PC penetration would explode for the next decade — and it actually did.
The boom summoned a supply response. Incumbent Japanese makers and rising Korean makers answered with aggressive expansion and process shrinks; roughly 50 fab construction plans were announced in 1995-1996 alone. Capex as a share of semiconductor output exceeded 30%, and yield improvements lifted bits per wafer, amplifying supply growth once more. Between 1995 and 1996, the market flipped from shortage to glut.
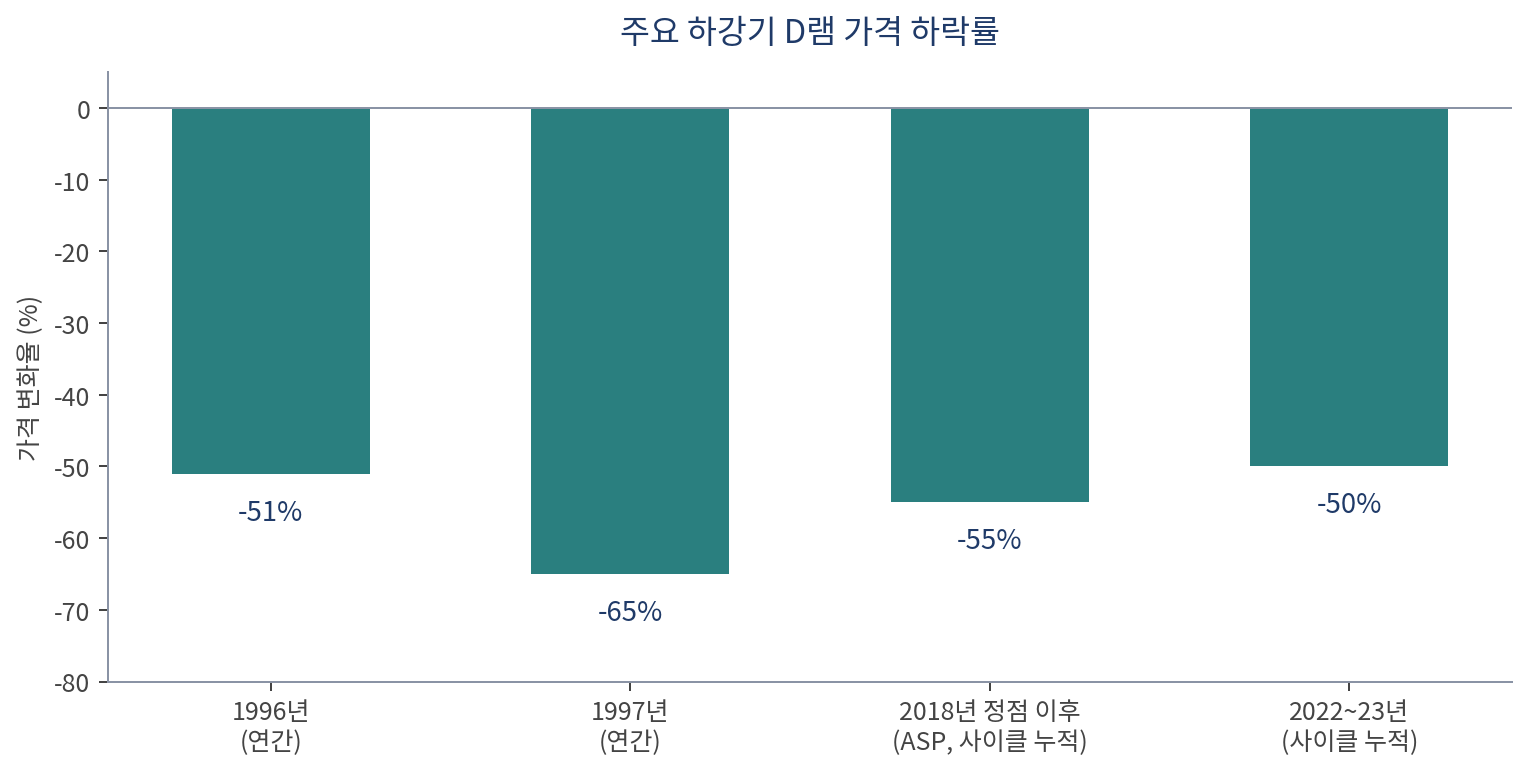
DRAM prices peaked in late 1995, then collapsed 51% in 1996 and another 65% in 1997 on an annual-average basis. Dollars per megabit fell from over $3 in 1995 to under 16 cents in 1998 — nearly twenty times cheaper in three years (EDN long-run series). Memory equities fell 60-80% from their peaks, and the overinvestment shock at Korea's three chipmakers, combined with excessive leverage elsewhere, became one pillar of the 1997 currency crisis.
The decisive fact is this: final demand grew in the very year of the collapse. By Nomura Research Institute's count, global PC shipments in 1996 reached 72.2 million units, up 21.7% year over year (other trackers put it at 17-18% — double-digit growth either way). While demand grew more than 20%, price fell 51%. The industry did not fail because demand forecasts were wrong — it failed because supply poured in faster on top of forecasts that were right.
DRAM price declines in major downturns (Source: EDN, SemiAnalysis, industry compilations)
<Chart 01> DRAM price declines in major downturns (Source: EDN, SemiAnalysis, industry compilations)
Attach the equity timetable and the lead appears. Micron's stock peaked in September 1995; DRAM prices peaked in late 1995 — the stock led price by about a quarter. From that peak to July 1996, 82% evaporated in ten months on an intraday-high basis. Korea followed the same sequence — the three chipmakers' shares topped while earnings were still setting records, then completed 60-80% declines through the earnings collapse and the currency crisis. From the very first cycle, the order was: share price, then price, then earnings.
The 1996-98 collapse rewrote the industry's structure. Over a 40-year span, of the roughly 23 companies that entered DRAM, three survived. The statistic says two things. First, even industrial-revolution-grade demand growing 40% a year cannot save an individual supplier. Second, the survivors' qualification was not forecasting skill but the balance sheet and cost position to endure downturns. Today's three-player oligopoly is the product of that culling, and the simultaneous output cuts of 2023 are the learned behavior of its survivors. CXMT — expanding outside that discipline with its home capital market's money — is precisely the participant that does not share this learning.
One more note on the macro transmission path. Korea's chipmaker overinvestment did not end as corporate losses; it traveled through chaebol debt structures tied to merchant banks' short-term foreign-currency borrowing and became one axis of the 1997 crisis — the first case of an industry cycle transmitting into a macro crisis through its funding structure.
Case II. 1999-2002 — The optical-fiber bust: the case where contracts existed and still failed
The optical bubble is adjacent to memory, but for this cycle it is the more important reference: it is the only case where contracts existed and the collapse happened anyway. In the late 1990s, carriers and startups deployed a trillion dollars of infrastructure on top of internet-traffic forecasts. Global Crossing laid more than 100,000 miles of subsea and terrestrial fiber linking some 200 cities in 27 countries, pre-selling capacity through long-term IRU (indefeasible right of use) contracts. And the traffic forecast itself was not wrong — internet usage exploded beyond the projections for the following decade.
The problem was not demand but the paying entity. The carriers and dot-coms that had contracted to buy capacity collapsed first, and the contracts became scrap paper. Global Crossing filed for bankruptcy on January 28, 2002, reporting $22.44 billion in assets and $12.39 billion in debt — then the fourth-largest bankruptcy in U.S. history. 360networks went bankrupt in June 2001, fourteen months after a $900 million IPO. WorldCom filed in July 2002 — then the largest ever, with assets in the $100 billion range — alongside an accounting fraud of $3.8 billion, later confirmed at around $11 billion, built on capacity swaps and costs reclassified as capex.
The physical scale of the glut was overwhelming. Of the fiber laid between 1999 and 2004, less than 5% is estimated to have ever been lit; as of 2001, 85-95% of strands sat dark. Wholesale bandwidth prices collapsed 90%, and more than $2 trillion of global telecom market value evaporated between 2000 and 2002. The equipment chain went down with it — Corning fell from above $100 to near $2.
The ladder of equity peaks — the marginal operator breaks first
In optical, equity peaks did not arrive at once; they descended like a ladder. The first to break was the operator with the weakest credit. Global Crossing rocketed from a split-adjusted $9.50 IPO price in August 1998 to $64 by early 1999 — a $47 billion market cap briefly exceeding GM — and that was effectively the top, nearly three years before the bankruptcy. Next came the equipment and materials chain: Nortel peaked in July 2000 with a market value approaching $250 billion (over C$360 billion), and Corning's all-time closing high was September 1, 2000. Capex peaked in 2000; bankruptcies peaked in 2001-2002. The order was: marginal buyers' equities, then the supply chain's equities, then physical investment, then credit events — with about a year between each rung. Traffic, the final demand, kept growing after the ladder had fully descended.
Overlay that ladder on the present and a reading method emerges. In this chain, the marginal buyers are the young cloud providers purchasing compute with borrowed money rather than their own cash flow; the supply chain is memory, optical modules, and power equipment. By optical grammar, the watch order is: marginal buyers' equities and funding conditions first, supply-chain equities second. That neocloud funding spreads and equities wobbled in the first half of 2026 before memory names entered their correction does not contradict this grammar.
Vendor financing — the market where suppliers lent out the demand
The optical bubble's funding structure had one device memory history lacks: vendor financing — equipment suppliers directly lending customers the purchase money. Lucent and Nortel lent billions to young carriers to buy their own gear, booked the revenue, and when the customers went bankrupt, the loans and the revenue evaporated together. Demand had been manufactured out of the suppliers' own credit. The device remains a litmus test for bubbles. In today's AI infrastructure chain, chip suppliers taking equity in neoclouds that then buy their chips, and the emergence of GPU-collateralized lending, can be read as vendor financing reborn in new forms — and the larger such structures grow, the more self-created demand must be netted out of the demand numbers. The memory makers' contract prepayments run in the opposite direction — customers paying suppliers in advance — which is healthier than vendor financing, but if those prepayments are sourced from hyperscaler debt issuance, the end of the chain is still the bond market.
The lesson is double-layered. First, a contract's value is the product of its terms and counterparty credit. IRUs were formally similar to five-year take-or-pay, but the signing counterparties' balance sheets were sandcastles of junk bonds and vendor financing. Today's contract counterparties are the best credits on the planet — but their capex has begun to move beyond free cash flow into the debt market, so this axis stays on watch. Second, fiber is not consumed; memory is. Once buried, cable remains permanent supply and suppressed prices for a decade. Memory is a consumable, absorbed into servers, so gluts clear within quarters through inventory digestion and output cuts. That is why optical's winter lasted ten years and memory's four to eight quarters.
1996 proved why "demand is huge, so it's fine" is not an argument; 2001 is the counterexample to "we have contracts, so this time is different." Contracts disappear together with their counterparties — but because buried fiber lasts forever while mounted memory is consumed, the same glut produces winters of different lengths.
Cases III and IV — The 2018 Decoupling and the 2022-23 Textbook Downturn
Key Points
—The arithmetic of the upside and the downside is the same equation.
Case III. 2016-2019 — Supercycle peak and the price-earnings decoupling
From late 2016, richer mobile specs and server-cloud demand overlapped and memory entered its second supercycle. Near the peak, on November 26, 2017, Morgan Stanley published "Time For a Pause," downgrading Samsung Electronics, Western Digital, and TSMC on NAND price declines and slowing profit growth ahead. It is the report the Korean market remembers by the nickname "the grim reaper," and the targeted names fell together on release. One detail worth keeping — the same report viewed DRAM more favorably than NAND and maintained overweight on Micron. Even the reaper's blade pointed first at NAND.
Earnings ran for another full year after the report. Samsung's 2018 annual operating profit reached KRW 58.9 trillion, a record above 2017's KRW 53.65 trillion. Micron, America's only pure memory maker, reported near-record results every quarter. But the stocks collapsed in between. Micron peaked around $64 in May 2018; revenue and margins peaked two quarters later, in its fiscal Q4 2018. By December the stock was around $28 — 56% gone in seven months, during every one of which the company was reporting record earnings.
Korea's timetable is more interesting still. Samsung topped half a year before Micron, in early November 2017 — just before the reaper report — at the pre-split equivalent of KRW 2.87 million, then slid through a full year of record earnings to bottom in early January 2019 at a post-split KRW 36,850, about 35% below the peak. SK Hynix peaked in late May 2018 at KRW 97,700, the same month as Micron, and fell about 40% by year-end. Earnings peaked in Q3-Q4 2018 for both Samsung and SK Hynix; DRAM contract prices also peaked in Q3 2018. In sum: Samsung led its earnings peak by three quarters, Micron and SK Hynix by one to two — within the same cycle, the diversified maker broke before the pure plays. The bottoms disagreed too: Micron and SK Hynix made their lows in December 2018 to early 2019, before earnings had even begun to collapse in earnest — and rallied through 2019 as the earnings destruction actually printed.
At the May 2018 peak, Micron's forward P/E (price divided by next-twelve-month consensus earnings) was 4-5x. On its face, the cheapest stock in history. The next year, Samsung's operating profit fell 52.8% to KRW 27.77 trillion; Micron's gross margin went from 58.9% in FY2018 to 30.6% by FY2020; DRAM contract prices fell nearly 30% in a single quarter in early 2019, the worst in eight years. /E divides price by believed future earnings — if the market stops believing the denominator, the multiple falls automatically. A 5x P/E did not mean cheap; it meant the market was rejecting the denominator — and in 2018 the market was right. The scale for reading today's forward P/Es — Samsung Electronics at 4.4x, SK Hynix at 4.7x, and Micron at 6.8x — must be the same one.
The sequence this case locked in is clear: equity peak, earnings peak one to three quarters later, price collapse, profits halved the following year. Morgan Stanley's memory-call record is also worth logging. November 2017: twelve months early, directionally right. August 2021's Micron downgrade also preceded the downturn. September 2024's SK Hynix underweight (target cut from KRW 260,000 to 120,000) was wrong and withdrawn a month later. Two out of three on direction — too good a record to consume as mockery. That Morgan Stanley again recommended reducing semiconductor exposure in early July 2026 should be read alongside it.
How the downturn ended is also worth recording. Amid crashing contract prices and swollen inventories in early 2019, the three suppliers cut capex and wafer starts; by the second half, data-center customers finished digesting inventory and resumed buying, and prices based. Peak to trough: about seven months for the stocks, five to six quarters for earnings — inside memory's standard four-to-eight-quarter downturn. What matters is the order of recovery: stocks turned first (December 2018), prices next (H2 2019), earnings last (2020). The stocks that led on the way down led on the way up. That symmetry tells you where to look for the bottom this time — not at earnings releases, but at the moment share prices stop falling on bad news.
Case IV. 2020-2023 — The pandemic cycle and the most honest downturn
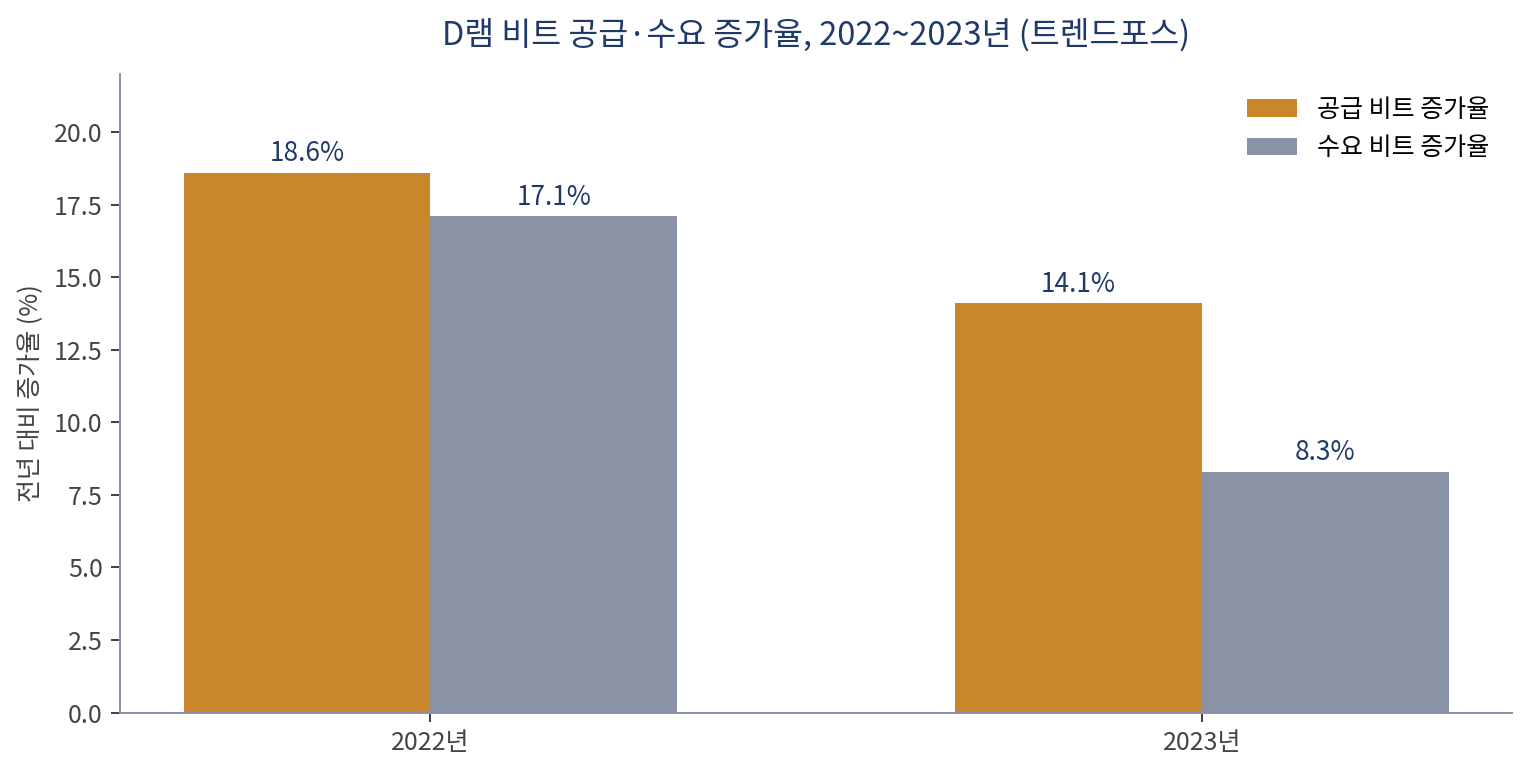
Memory ran on pandemic demand through 2021 and met the most textbook downturn of the five in 2022. What makes this cycle special is that the glut was announced in advance, in numbers, precisely. TrendForce's November 2021 outlook: 2022 DRAM bit supply +18.6% versus bit demand +17.1% — the market flips from shortage to surplus, ASP falls 15%. And that is exactly what happened. Demand did not shrink — it grew 17.1%. Supply merely grew 1.5 percentage points more. That 1.5 points knocked prices down 15%. Roughly 10x leverage of price to the gap — the most important constant in memory-cycle analysis.
DRAM bit supply and demand growth, 2022-2023 (Source: TrendForce)
<Chart 02> DRAM bit supply and demand growth, 2022-2023 (Source: TrendForce)
In 2023, DRAM bit demand growth fell to 8.3% — below 10% for the first time ever. The worst demand environment in history, and demand still grew. With supply up 14.1%, the gap widened to 5.8 points and the P&L caved. SK Hynix reported a Q4 2022 operating loss of KRW 1.7 trillion on revenue of KRW 7.7 trillion (net loss KRW 3.5 trillion) — its first quarterly loss since Q3 2012 — while the CFO called the price decline the worst since Q4 2008 and industry inventory likely the highest ever. For full-year 2023: revenue KRW 32.77 trillion, operating loss KRW 7.73 trillion. DRAM prices fell in repeated 20%-plus quarterly steps, more than 50% cumulatively.
The equity lead was the longest of the five cases. Samsung peaked intraday at KRW 96,800 in early January 2021; SK Hynix two months later, around KRW 150,000 in early March 2021. Yet DRAM prices peaked in Q3 2021, and earnings peaked at Samsung in Q3 2021 but at SK Hynix and Micron in the first half of 2022 — Samsung's stock led its own earnings peak by two quarters, and the others' peaks by roughly five. Only Micron held out near its earnings peak, topping around $98 in January 2022. The bottoms met in almost the same place: late September to early October 2022 — Samsung KRW 51,800 (about −46%), SK Hynix KRW 73,100 (about −51%), Micron in the $48 range (about −50%) — one quarter before SK Hynix printed its record quarterly loss, ahead even of the output-cut announcements. Bottoms completed before the worst earnings printed, and stocks rallied through the loss-making 2023 — an exact repeat of 2019's recovery grammar.
The exit from that downturn is the entrance to this cycle. The three suppliers cut output simultaneously for the first time in history — Samsung widened cuts to as much as 50% on NAND — and from 2024 through early 2025 the industry effectively froze new capacity investment. By TrendForce's tally, concentrated cuts drained inventory and prices turned from October 2023, with Q4 2023 contract prices rebounding 13-18%. Then came the problem: when AI demand exploded in mid-2025, the industry was sitting on a two-year investment vacuum. By late 2025, supplier DRAM inventories had drained to multi-year lows, and in 2026 DRAM contract prices jumped in the 90%s (93-98%) in the first quarter alone. Today's shortage is not the product of AI demand alone — it is a joint product with the supply vacuum the 2022-23 downturn created.
Simultaneous cuts were not spontaneous; they are structural. Before consolidation, memory was an industry where cuts were impossible — a prisoner's dilemma in which whatever I cut, a competitor takes, so with many players the rational choice was always to add. Only after 23 became 3, each firm repeatedly learned downturn P&L, and the shared math that price matters more than utilization in a high-depreciation industry, did all-player cuts become an equilibrium — in 2023, for the first time. That discipline is the hidden premise of this cycle's supply curve. So this cycle's supply risk arrives by two routes: the participant outside the discipline — CXMT — and rational betrayal inside it — each firm's individual optimization rolling HBM capacity back to commodity as margin gaps dictate. That the latter was already observed in mid-July is a point taken up later.
2022-23 is both the proof of the gap arithmetic and the direct cause of the current supercycle. If 1.5 points of excess supply broke prices 15%, today's surge means the demand-side gap is that large in reverse. And symmetrically — the moment new capacity lights up in 2027-28 and the gap flips sign, the same 10x leverage works in the opposite direction. The arithmetic of the upside and the downside is the same equation.
Full access requires 🥉 Bronze tier
Sign in with Google — your tier will be checked automatically and access granted if eligible.
This site runs on ads — the tier system rewards community contributions.
Comments
This report is provided for informational purposes only and does not constitute a recommendation to buy or sell any financial instrument. Investment decisions should be made based on your own judgment and responsibility. The analysis and opinions contained herein are based on information available at the time of writing and are subject to change.