NewMoneyMoves
PerspectivesResearchTerminalsWeekend RWABoard
THEME
EnergyGlobal ThemeFront-runBioRoboticsMobilityInfra
››Thematic Deep Dive
GLOBAL THEME

Every Market the Memory Big-Three Are Leaving

Market Sizing · Follower Revenue/Profit · A Quantitative Re-rating Read

HHaelangdal·Founder AnalystApril 26, 202655 min readThematic Deep Dive
Bottom Line

The Big-Three's $40-50B combined legacy exit creates a structural cycle where eight followers step in — with potential multiple re-rating for Hana Micron, Simmtech, and Daeduck.

NewMoneyMoves

Global Investment through Themes

Content

ThemesIdeasReportsEarnings

Explore

GuideETFsPerspectivesTelegramNVIDIA PortfolioWeekly ReviewCredit & Leverage

Community

Daily News

Legal

Privacy PolicyTerms of ServiceDisclaimer

© 2026 NewMoneyMoves. All rights reserved.

Reader's Brief — 30-second TL;DR

Advanced
Why Now

The HBM 3:1 wafer-conversion ratio and SK Hynix's fab role reallocation make a return to legacy production structurally impossible — the core insight driving this report.

Winners ?? Losers

Beneficiaries — Hana Micron (P/OP 9.9-10.3x), Simmtech (12.2-14.5x), Daeduck (25.8-39.7x), Nanya and Winbond in Taiwan. Pressure — Chinese followers attempting legacy re-entry.

Watch For

Quarterly order backlog and operating margin trends at Hana Micron and Simmtech — whether P/OP multiples converge toward peer averages is the re-rating completion indicator.
Reading depth
  1. 011. Sizing the Markets the Big-Three Are ExitingThe Big Three are exiting a $40~50B footprint of 5~15% margin markets to reallocate capacity toward 50~70% margin HBM.Jump to section
  2. 022. Why the Big-Three Are Exiting — A Quantitative ReadReallocating the same wafer capacity to HBM and high-density DDR5 yields a business 5~10x more profitable, making the exit quantitatively rational.Jump to section
  3. 033. Followers' Revenue and Operating Profit (Primary-Source Verified)How much followers benefit from the vacated markets depends on their capacity build-out and utilization recovery.Jump to section
  4. 044. Re-rating — A Quantitative ReadFollowers' re-rating range hinges on whether a 2026 full-year operating-profit consensus exists and whether it is realized.Jump to section
  5. 055. Bringing It Together — Markets Vacated, Markets CapturedThis note assigns no buy/sell view or arbitrary probabilities and offers only a verified, fact-based multiple comparison.Jump to section
  6. 06Appendix — What Does 'Big-Three Leaving' Mean from a Process Perspective?The Big Three leaving means node upgrades, new HBM fabs, new packaging capacity, and staged legacy-fab EOL happening at once, with capacity itself the near-term bottleneck.Jump to section

1. Sizing the Markets the Big-Three Are Exiting

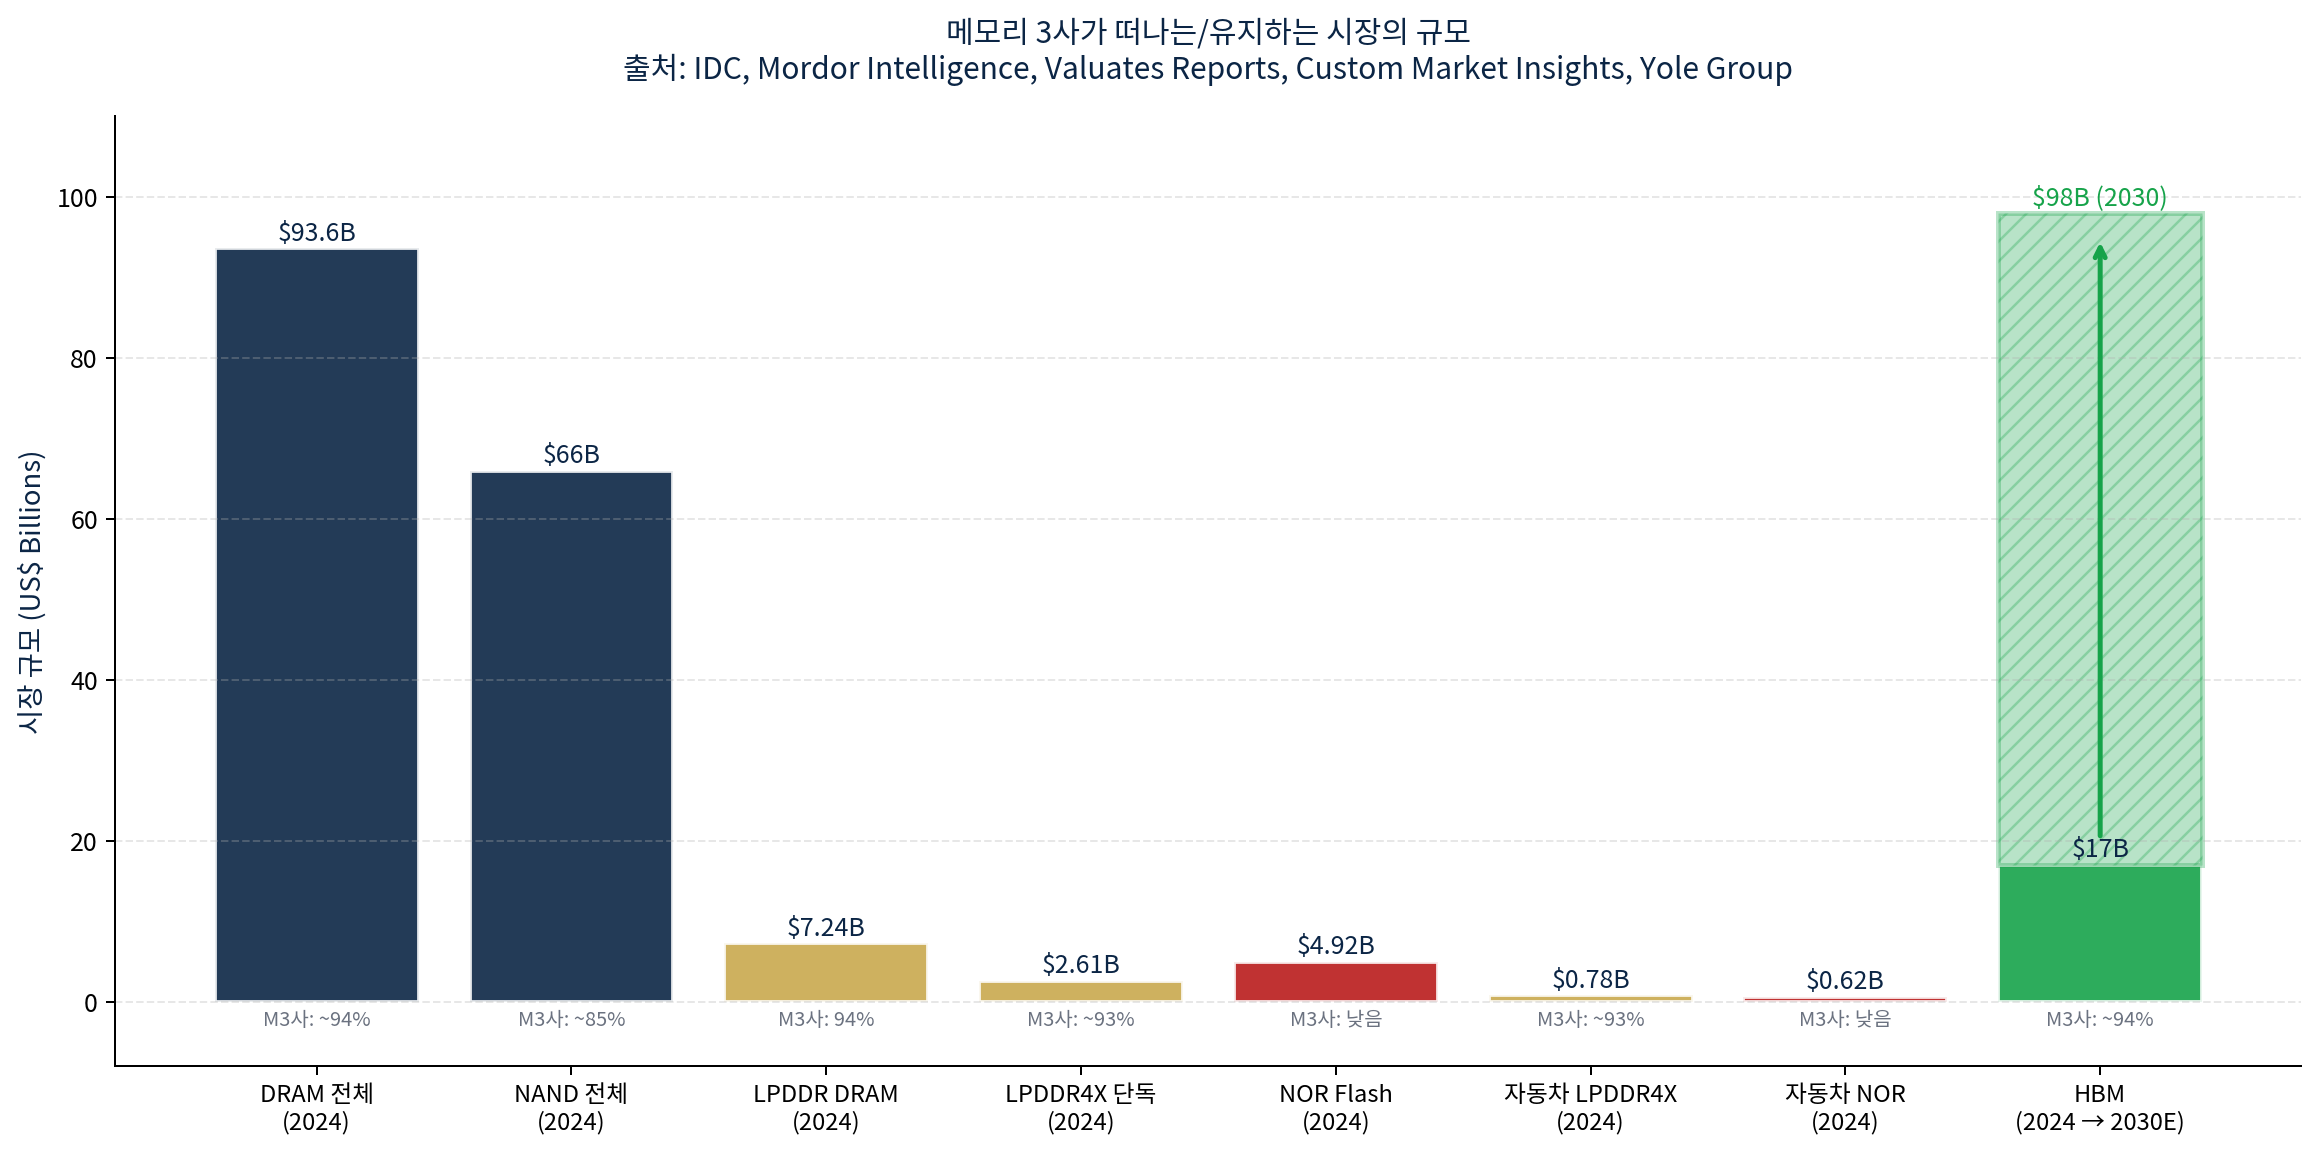
Chart 1: Sizing markets the memory big-three are exiting vs. holding (TAM)

TAM by Segment (Primary Sources)

Market2024 TAMM3 ShareM3 RevenueSource
DRAM total$93.6B~94%~$88BIDC, Counterpoint
total$66B~85%~$56BMordor Intelligence
LPDDR DRAM total$7.24B93~95%~$6.8BValuates Reports
stand-alone$2.61B~93%~$2.4BValuates Reports
NOR Flash$4.92Bvery lowminimalCustom Market Insights
Auto LPDDR4X$0.78B~93%~$0.7BValuates Reports
HBM (reference)$17B → $98B (2030)~94%~$16B → $92BYole Group
Market
DRAM total
2024 TAM
$93.6B
M3 Share
~94%
M3 Revenue
~$88B
Source
IDC, Counterpoint
Market
NAND total
2024 TAM
$66B
M3 Share
~85%
M3 Revenue
~$56B
Source
Mordor Intelligence
Market
LPDDR DRAM total
2024 TAM
$7.24B
M3 Share
93~95%
M3 Revenue
~$6.8B
Source
Valuates Reports
Market
LPDDR4X stand-alone
2024 TAM
$2.61B
M3 Share
~93%
M3 Revenue
~$2.4B
Source
Valuates Reports
Market
NOR Flash
2024 TAM
$4.92B
M3 Share
very low
M3 Revenue
minimal
Source
Custom Market Insights
Market
Auto LPDDR4X
2024 TAM
$0.78B
M3 Share
~93%
M3 Revenue
~$0.7B
Source
Valuates Reports
Market
HBM (reference)
2024 TAM
$17B → $98B (2030)
M3 Share
~94%
M3 Revenue
~$16B → $92B
Source
Yole Group

Aggregating 'DDR4 + LPDDR4X + auto/industrial + Crucial consumer SSD' gives a combined exited-market footprint of ~$40~50B. The exact 'big-three sub-product breakdown' is not in public filings, hence the range, but operating margins in those segments were typically 5~15% versus 50~70%+ for HBM/SOCAMM2/cHBM (SK hynix 1Q26 quarterly OPM 71.5%).

Takeaway

The Big Three are exiting a $40~50B footprint of 5~15% margin markets to reallocate capacity toward 50~70% margin HBM.

Full access requires a free account

Sign in with Google to unlock the full body of every free report instantly.

Sign in with Google

This site runs on ads — the tier system rewards community contributions.

Comments

This report is provided for informational purposes only and does not constitute a recommendation to buy or sell any financial instrument. Investment decisions should be made based on your own judgment and responsibility. The analysis and opinions contained herein are based on information available at the time of writing and are subject to change.

All Reports
Home
Research
Company
Macro
Theme