The memory 3 are in a window, unprecedented in any prior memory cycle, of executing record capex and holding record return capacity at the same time. The capacity itself is shared, but the timing, ratio and method of payment differ -- and that difference has already begun showing up in first-week-of-August stock prices.
Reader's Brief — 30-second TL;DR
Advanced
Why Now
Record quarterly results were confirmed -- Samsung's operating income of 89.5 trillion won, SK Hynix's 60.5 trillion won, and Micron's $33.7 billion (about 47.8 trillion won), combined roughly 198 trillion won -- alongside Micron's December 9, 2026 buyback restart, SK Hynix's flagged third-quarter return announcement, and Samsung's CFO signaling its next policy.
Winners ?? Losers
Return capacity itself is ample at all three. On policy specificity, Micron (full amount, every year, on a fixed date) is ahead of Samsung and SK Hynix (half, settled after three years), and that gap showed up in first-week-of-August stock moves (Micron +7.1% vs. Samsung -12.0% and SK Hynix -17.2%). In a downturn scenario, Samsung's regular dividend of 9.8 trillion won and SK Hynix's fixed dividend provide an explicit floor, while Micron's dividend floor is effectively immaterial against its market cap.
Watch For
Micron's momentum-index exclusion in the third week of September (more than $2.3 billion of rebalancing sales) -> Micron's buyback restart on December 9 -> SK Hynix's additional return announcement in Q3 -> Samsung's next three-year policy (2027-29, expected around year-end/early next year) -> whether the historical pattern of a market collapse the year after a capex peak repeats in 2027.
Reading depth
The Memory Capex Cycle, 2016-2026: Two Collapses
Before discussing capacity, the history capex needs to be laid out first. What extinguished shareholder returns at the three memory makers over the past decade was not weak demand -- it was capex. Overlaying the ten-year trajectory of combined capex with DRAM market size reveals the shape of the cycle.
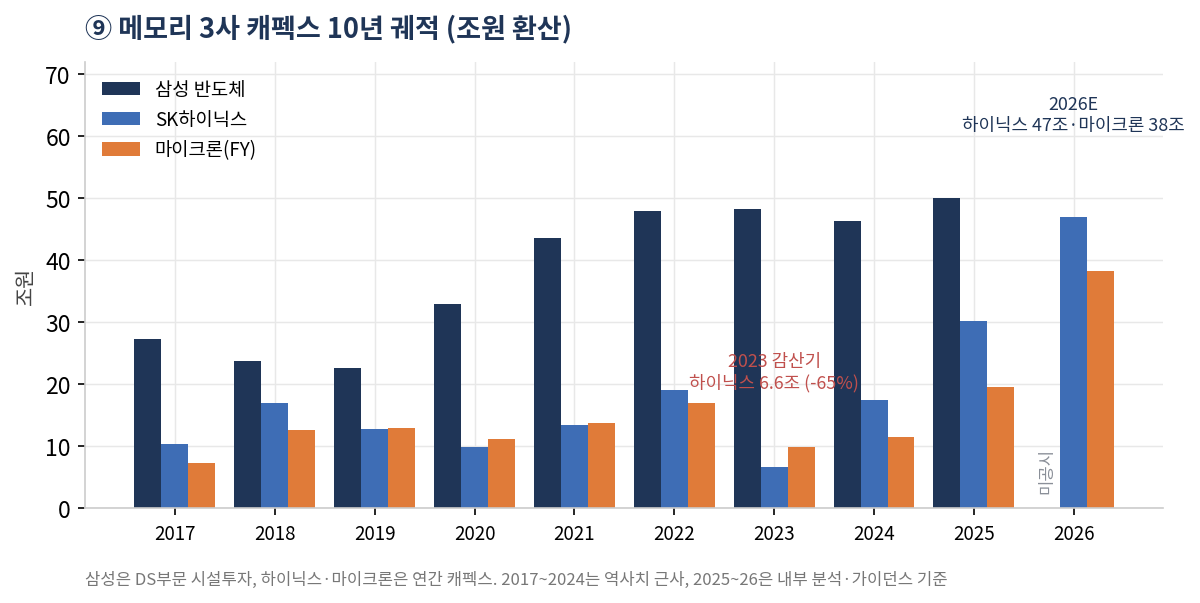
Ten-year capex trajectory of the memory 3 -- Samsung DS division facility investment, SK Hynix and Micron annual capex, converted to trillion won
Ten-year capex trajectory of the memory 3 -- Samsung DS division facility investment, SK Hynix and Micron annual capex, converted to trillion won
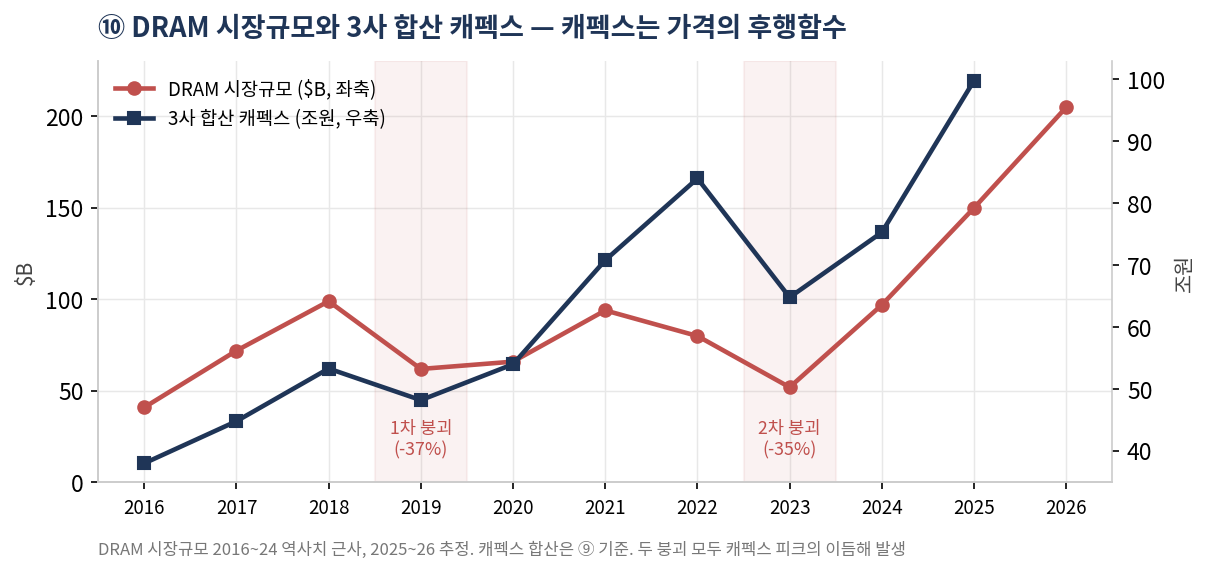
DRAM market size vs. combined capex -- capex is a lagging function of price. Both market collapses came the year after a capex peak
DRAM market size vs. combined capex -- capex is a lagging function of price. Both market collapses came the year after a capex peak
The first supercycle and collapse (2016-2019)
In the second half of 2016, server demand and supply constraints combined to lift the DRAM market from $41 billion in 2016 to $99 billion in 2018 -- a 2.4x jump in two years. All three companies plowed profits into capex. Samsung's semiconductor facility investment hit a then-record 27.3 trillion won in 2017; SK Hynix raised capex 65% to 17.0 trillion won in 2018; Micron's fiscal 2018 capex reached $8.9 billion, also a 2.4x rise in two years. Combined capex peaked in 2018 at 53 trillion won, and the DRAM market collapsed the very next year, 2019 (-37%) -- a lag created by the 12-18 month lead time between fab construction and market supply.
It was in this window that Micron made its May 2018 capital return pledge: 50% of returned plus a $10 billion buyback. At the time of the announcement, fiscal 2018 FCF was $8.5 billion; by fiscal 2020, FCF had fallen to effectively zero. The buyback program, after spending $2.7 billion in fiscal 2019, became largely dormant. It was the first case of a return policy designed around peak FCF disappearing along with the cycle.
The pandemic cycle and second collapse (2020-2023)
When the market re-expanded on stay-at-home demand in 2020-21 (reaching $94 billion in 2021), capex rose again. Samsung set consecutive records at 43.6 trillion won in 2021 and 47.9 trillion won in 2022; SK Hynix spent 19.0 trillion won in 2022; Micron spent $12.0 billion in fiscal 2022. Combined capex peaked in 2022 at 84 trillion won. The market collapsed the following year, 2023 (-35%).
This time, the response diverged. SK Hynix cut 2023 capex 65% to 6.6 trillion won and moved to reduce output; Micron cut fiscal 2023 capex 42% to $7.0 billion. Only Samsung held investment steady at 48.3 trillion won, defending market share. That production cut became the starting point for the 2024-25 supply shortage and the current cycle. On the return side, 2023 was the year SK Hynix maintained its fixed dividend of 1,200 won even while posting a loss, and the year Micron kept its dividend but effectively suspended buybacks -- the first real-world test of the fixed-dividend floor's credibility.
The AI cycle (2024-2026)
In 2024, HBM (high bandwidth memory) demand restored the market to $97 billion, and 2025-26 has become a broad shortage extending even to conventional server DRAM. The capex response has been steeper than in either prior cycle. SK Hynix told its July earnings call it expects 2026 investment in the high-40 trillion won range (up in the high 50% area from 30.2 trillion won a year earlier; internal estimates put the figure near 47 trillion won). Micron's CFO confirmed fiscal 2027 capex only as "mid-$40 billion range or higher" -- nearly double fiscal 2026's $27 billion. Samsung does not issue separate guidance but is trending upward with the new Pyeongtaek fab and the second Taylor phase. Combined capex across the three has more than doubled from the 2023 trough of 65 trillion won in three years.
-- a different picture than the absolute number
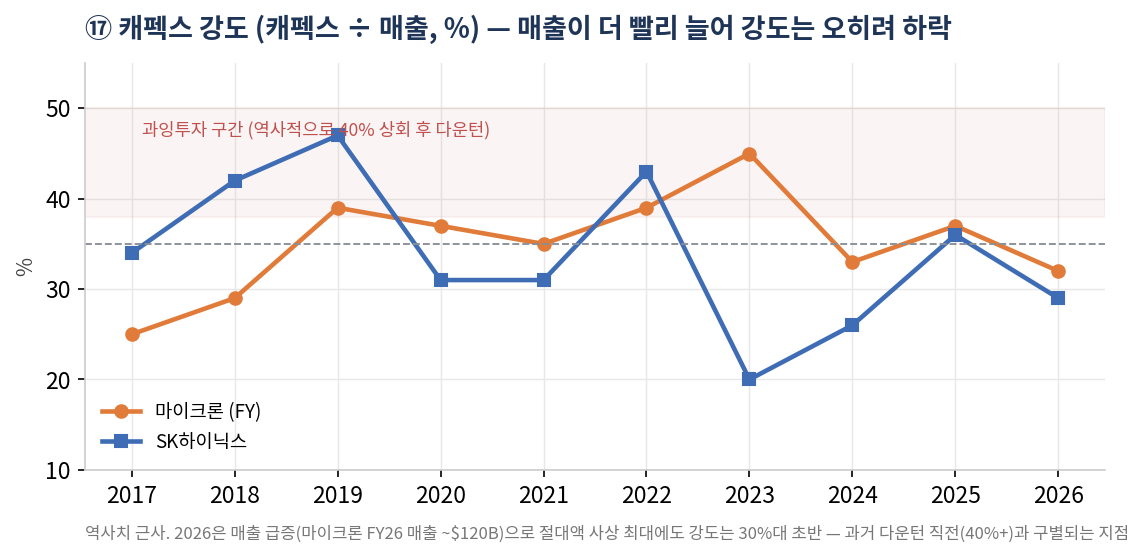
Capex intensity (capex divided by revenue, %) -- revenue is growing faster, so intensity is actually falling. Both prior downturns had intensity above 40% beforehand
Capex intensity (capex divided by revenue, %) -- revenue is growing faster, so intensity is actually falling. Both prior downturns had intensity above 40% beforehand
In absolute terms this expansion is the largest ever, but capex intensity relative to revenue tells a different story. In the year before each of the two prior downturns, Micron's and SK Hynix's capex-to-revenue ratio exceeded 40% (Micron 39% in fiscal 2019, 45% in fiscal 2023; SK Hynix 47% in 2019, 43% in 2022). Currently, revenue is growing faster than capex, so intensity has actually fallen into the low-30% range. Micron's fiscal 2026 capex of $27 billion against roughly $120 billion of revenue (reflecting fourth-quarter guidance) puts intensity at 22-23%; even placing fiscal 2027 capex of $45 billion-plus against $200 billion of revenue yields 22-25%. This cycle's capex is not yet outrunning revenue in the pattern of past overinvestment.
The limits of this metric matter, though. The denominator -- revenue -- reflects today's peak prices; once prices normalize, intensity will spike automatically. The 2019 spike in intensity, too, was produced by a revenue collapse, not a capex increase. Capex intensity is a gauge of whether investment looks excessive right now, not a guarantee of future safety.
Mechanically applying the historical rule -- market collapse the year after a capex peak -- points to 2027-28 as the test window. But this cycle has two structural features absent from the past. First, LTAs (long-term agreements) and SCAs (strategic capacity agreements) have locked in volume and floor prices by , changing the speed at which supply responses reach price. Second, the source of demand is not the consumer but a capital-allocation decision made inside Big Tech (M7) capex. A different structure does not mean no cycle at all. Contracts only create a lag; combined capex above 135 trillion won will eventually convert into physical production capacity.
Ten Years of Shareholder Returns: Micron's Pledge and Its Disappearance
Key Points
—Micron's 2018 pledge disappeared the very next year for a simple reason: a policy designed around peak earnings vanishes once the peak passes.
Micron's return history is short and cycle-dependent.
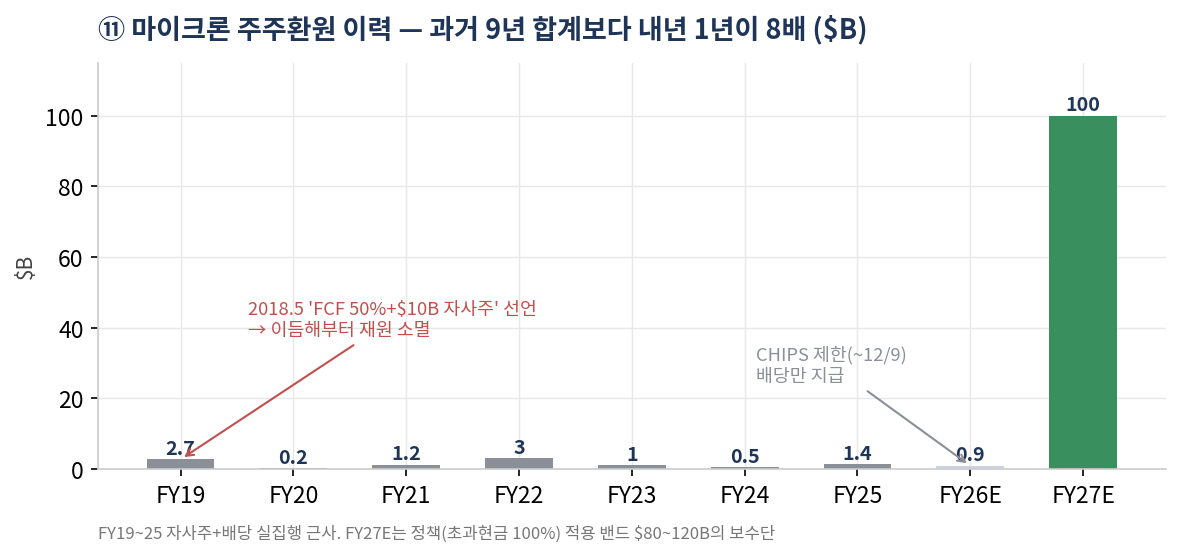
Micron shareholder return history -- next year alone will be 8x the sum of the prior nine years ($B)
Micron shareholder return history -- next year alone will be 8x the sum of the prior nine years ($B)
At its May 2018 analyst day, Micron pledged to return 50% of FCF and buy back $10 billion in stock. Actual execution peaked at $2.7 billion in fiscal 2019 and ranged between $0.2-3.0 billion a year for the following five years. It introduced its first dividend in fiscal 2022 at $0.10 a quarter, so the dividend history itself is now five years old. Even amid a fiscal 2023 FCF deficit of -$6.1 billion, the dividend was maintained, but buybacks stopped. Cumulative returns over the nine years from fiscal 2019 through the most recent completed year total roughly $11 billion -- less than a tenth of the estimated fiscal 2027 band of $80-120 billion.
The current policy (100% of excess cash) differs from the past in two ways. First, it is the full amount, not a ratio. Second, an external constraint -- the CHIPS agreement (the U.S. semiconductor subsidy pact) -- fixes the start date to December 9, 2026. Where the earlier pledge was discretionary execution "as capacity allows," this time both the definition of the funding source (excess cash) and the timing are explicit. Still, the fact that the size of the funding source is itself a function of the cycle is unchanged from 2018.
Micron's 2018 pledge disappeared the very next year for a simple reason: a policy designed around peak earnings vanishes once the peak passes.
Samsung Electronics: Four Generations of a Three-Year Return Policy
Samsung's returns are best read as a sequence of policy generations.
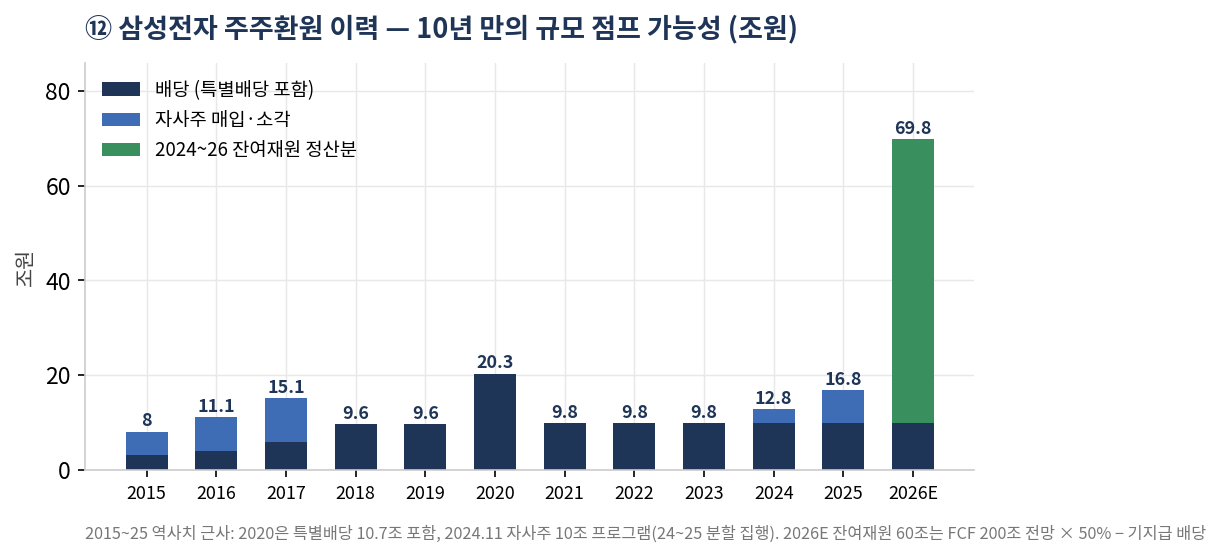
Samsung Electronics shareholder return history -- a possible scale jump after ten years
Samsung Electronics shareholder return history -- a possible scale jump after ten years
Generation 1 (2015-17) overlapped with the Elliott Management activist campaign, combining a special buyback and cancellation of 11.3 trillion won with a dividend increase to execute 8-15 trillion won a year. Generation 2 (2018-20) paired a fixed annual dividend of 9.6 trillion won with a settlement equal to 50% of cumulative three-year FCF; in the final year, 2020, a special dividend of 10.7 trillion won (1,932 won per share) settled the account, bringing total returns that year to 20.3 trillion won. Generations 3 (2021-23) and 4 (2024-26) have maintained a fixed annual dividend of 9.8 trillion won, with a separate share buyback program added in November 2024 for share-price defense. That 10 trillion won program ran from November 2024 through September 2025, with 8.4 trillion won cancelled and 1.6 trillion won used for employee compensation.
What matters is the size of the next settlement. The cumulative three-year FCF that funded the Generation 2 settlement (the 10.7 trillion won special dividend) spanned a semiconductor downturn. Generation 4 (2024-26) has an FCF forecast of 200 trillion won layered onto its final year -- a settlement that could be an order of magnitude larger than before. Plugging just 2026 FCF into the policy formula alone yields a residual funding pool of 60-80 trillion won, six to eight times the 2020 special dividend. That said, 2024-25 FCF was relatively weak, so confirmation of the actual three-year cumulative figure is needed, and the real announcement will likely come alongside the next (fifth) policy (2027-29) around year-end or early next year. The CFO signaled on the Q2 call that an update on "fulfilling the shareholder return commitment" was coming.
Samsung's next settlement is estimated at six to eight times the 2020 special dividend, and its funding is already an extension of confirmed second-quarter results.
Full access requires 🥉 Bronze tier
Sign in with Google — your tier will be checked automatically and access granted if eligible.
This site runs on ads — the tier system rewards community contributions.
Comments
This report is provided for informational purposes only and does not constitute a recommendation to buy or sell any financial instrument. Investment decisions should be made based on your own judgment and responsibility. The analysis and opinions contained herein are based on information available at the time of writing and are subject to change.