Documents, Not Shovels — The Stock-Price Grammar of Memory Capacity Cycles
How to read the Korea–US–Japan mega-expansion wave and the early-July crash — what broke the stocks was not groundbreaking but documents combined with a demand crack, and a contract revolution is rewriting that grammar
What broke memory stocks was never the shovel — the fab groundbreaking. It was documents — reports, guidance, contract news. Whether a document shock pushes the stock up or down is decided by one thing: does the document match a real demand crack. In the July shock, the document is out, but confirmation of substance has not arrived. Consensus has not come down, and contract prices have not turned to decline.
Reader's Brief — 30-second TL;DR
Advanced
Why Now
Korea, the US, and Japan announced mega-expansions at the same time — 100 trillion won in Cheongju, 140 trillion won from Samsung, and Micron's Hiroshima groundbreaking. On top of that came the early-July crash (KOSPI −7.89%, SK hynix −14.57%). The old formula — 'expansion means the top is in' — was promptly summoned. But this expansion wave comes with variables past cycles never had: price-cap removal, prepayments, and multi-year long-term agreements (LTAs).
Winners ?? Losers
If prices keep rising, SK hynix — which removed the price cap — leads on earnings quality. If prices flatten out on a high plateau, Micron — which bound a cap and a floor together — leads. If commodity DRAM price hikes stick, Samsung Electronics — which holds the largest capacity — leads. The moment an expansion announcement without a contract reappears, that is the common warning signal for all three.
Watch For
Reading depth
Part 1 — The Thesis: Four Clocks and the Historical Ledger
§1.1 The Frame: Four Clocks Run in Every Cycle
Information around the memory cycle moves at four different speeds, in four layers. This report calls them the 'four clocks' — four timetables running at different speeds over the same cycle. First is the document clock. Analyst reports, capex (capital spending) guidance in earnings releases, and -signing news belong here. Second is the stock- clock. Third is the contract-price clock. Fourth is the concrete clock. Physical events — groundbreaking, equipment move-in, ramp (the process of pushing production utilization up), completion — belong here. The common assumption is that physical moves the market. The data shows the exact opposite order.
The order is fixed. Documents move first. The stock reacts to the documents. Contract prices confirm their peaks and bottoms several months after the stock. Concrete shows up only after all of that is over. The reason a groundbreaking ceremony carries no information value is simple. That capex was already fully priced in quarters earlier, through guidance and investment announcements. The groundbreaking is just a photo op for an announcement already made. What the market prices in ahead of time is the change in bit (growth measured in memory capacity) expectations. The channel that carries that information is not the shovel. It is the document.
What moves with the stock is the document clock, not the concrete clock. So the risk of expansion news should be measured not by whether the announcement is a groundbreaking or a completion, but by whether it changes the demand outlook.
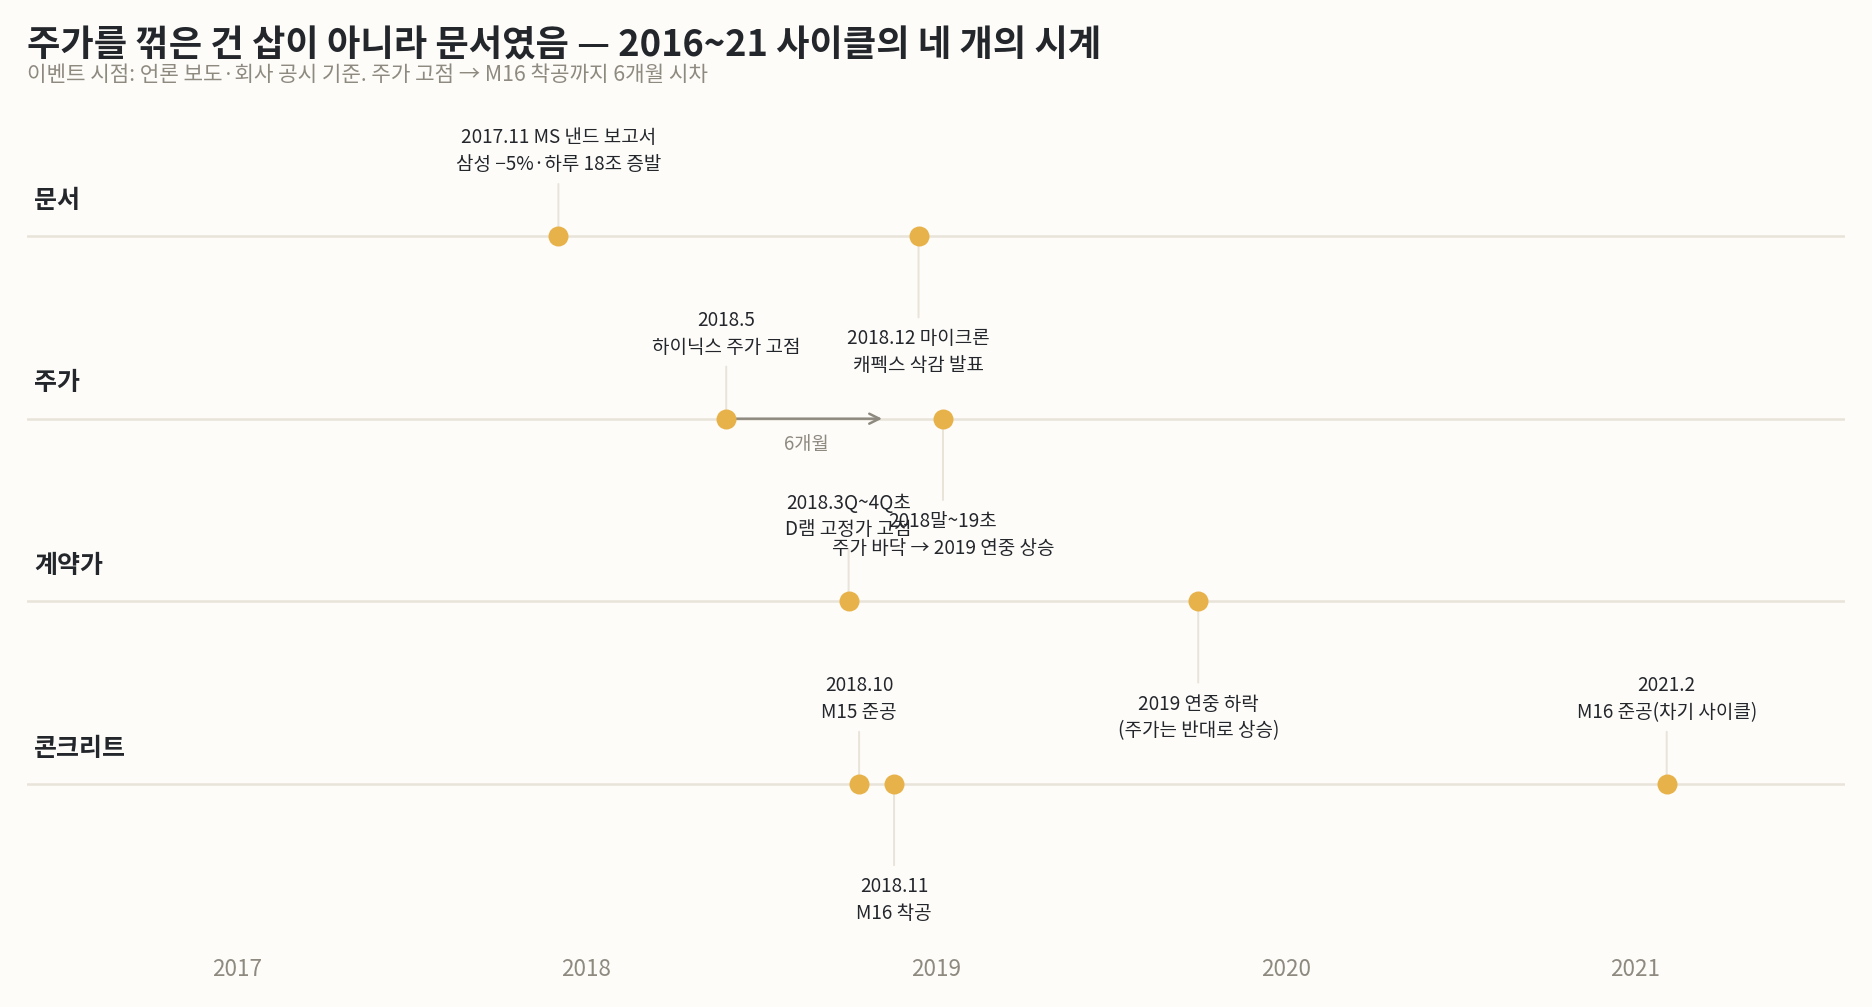
<Figure 1> The four clocks of the 2016–21 cycle — the lags between documents, stock, contract price, and concrete
Throughout the upturn, supply documents had no power. In 2017, while Samsung Electronics executed record capex, the stock kept climbing. Samsung's operating profit that year hit a record 53.645 trillion won. The next year it broke that record again at 58.8867 trillion won. Adding supply, by itself, was no enemy of the stock — as long as demand absorbed it.
The first crack was a document, dated November 27, 2017. A global investment bank forecast falling NAND prices and cut its Samsung Electronics price target. The stock fell 5% in a single day, erasing 18 trillion won of market cap. SK hynix fell 2.35% alongside. Not a single shovel had touched the ground; one report produced the whole drop. But another investment bank pushed back, calling the worry overdone. Demand was fine. The stock soon recovered and printed its final top in May 2018. The peak in the DRAM fixed transaction price — the bulk contract price suppliers agree with large customers on a monthly or quarterly basis — came 4–5 months later, in Q3 to early Q4 2018.
The groundbreaking came after all of it was over. M16 broke ground in November 2018. Six months after the stock top. The press recorded that DRAM prices were already rolling over at the time, and that voices of concern were heard inside the group. In this cycle, the groundbreaking was neither the trigger for the rise nor the trigger for the fall. It was an investment decision pushed through in the middle of a downturn, with prices breaking. The M15 completion (2018) was likewise an event trailing near the price peak.
In the 2016–19 cycle, every event that changed the stock's direction was a document. Groundbreakings and completions were mere confirmations that followed, unrelated to the stock. The correlation between the concrete clock and the stock is close to zero.
§1.3 2021 and 2024: The Two Faces of the Document
The 2021 cycle replayed the same grammar in compressed form. The stock peaked in early 2021. The contract price peaked in Q3. In between, in August, two documents landed together. One was a market research firm's forecast of up to a 5% drop in Q4 PC DRAM prices. The other was a global investment bank's semiconductor-winter report. The two overlapped and a second leg down hit. Once again the trigger was a document, not a physical event. And this document matched a real demand crack — the inventory correction in PCs and mobile. So the cycle actually turned.
The document of September 2024 is the opposite case. A global investment bank published a 'winter is coming' report. On the back of it, it cut its SK hynix price target 54%, from 260,000 won to 120,000 won. It cut its Samsung Electronics target 27% too. SK hynix plunged 6.14% on the first trading day after publication, down to 152,800 won. The grounds: falling commodity DRAM demand and HBM oversupply. But what came next was not winter. It was a supercycle. SK hynix went on to rise more than tenfold in a year and a half, and its market cap broke 2,000 trillion won.
Overlay the two cases and the thesis sharpens. Documents only create volatility. What decides direction is whether the document matches a real demand crack. The documents of November 2017 and September 2024 claimed cracks with no substance, and the market recovered. The document of August 2021 pointed at a crack with substance, and the cycle turned. So when a document shock hits, the question to ask is not the size of the drop. It is whether consensus earnings estimates have actually started coming down.
After a document shock there are only two roads. No substance means recovery; substance means trend reversal. The verdict criterion is the direction of consensus estimates, and that is this report's first watch variable.
§1.4 The Symmetry at the Bottom: Production-Cut Documents Make the Bottom
The thesis holds in exact symmetry on the downside — at the bottom. In late 2018, the memory industry announced investment cuts and production cuts in succession. The stock then formed its bottom between late 2018 and early 2019. Through all of 2019, while DRAM prices kept falling, the stock rose instead. It rose during the very period when the completed M15 and M16 were actually running and supply was increasing. One more piece of evidence that the stock moves opposite to physical supply.
M16 was completed in February 2021. A total of 3.5 trillion won, 25 months after groundbreaking. By then the market was already in the middle of the next upcycle. In the completion address, the group chairman recalled that a groundbreaking decision made in the downturn had led to a completion in the upturn. A supplier confirming this report's thesis in his own words. Concrete time and market time flow differently. In short, what makes the bottom is also a document — the production cut — not the concrete of a completion.
Up or down, the information that leads the stock is the document. The grammar history teaches is this: read production-cut and investment-cut documents as buy signals, and contract-less expansion documents as warning signals.
Full access requires a free account
Sign in with Google to unlock the full body of every free report instantly.
This site runs on ads — the tier system rewards community contributions.
Comments
This report is provided for informational purposes only and does not constitute a recommendation to buy or sell any financial instrument. Investment decisions should be made based on your own judgment and responsibility. The analysis and opinions contained herein are based on information available at the time of writing and are subject to change.