Reading depth
1. What the 5% 10-Year Is Made Of
US figures in this report are September 14 closing levels, Asian figures are September 15 closing levels, and the weekly valuation numbers come from September 11 data.
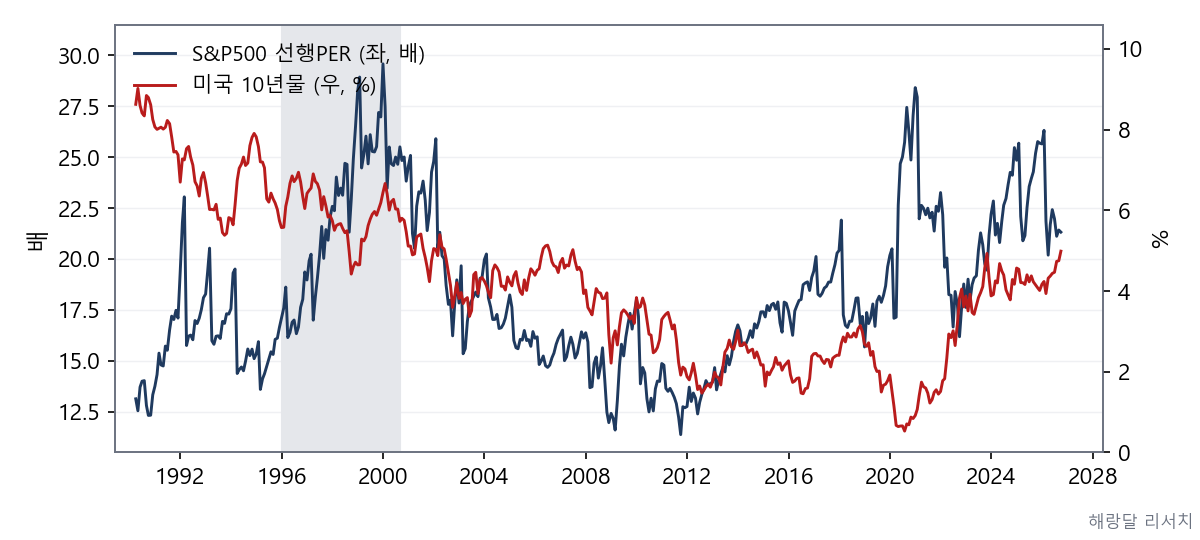
The 10-year at 4.99% is the highest in monthly data since June 2007, and set against everything since 1980 it lands right in the middle. A little more than half of that period ran at lower yields than today.
In the 1990s the 10-year ran between 5% and 8%, and equities built a ten-year bull market on top of it. The 5% level by itself does not set the ceiling for share prices, because what sets that ceiling is the makeup of the and the speed of earnings.
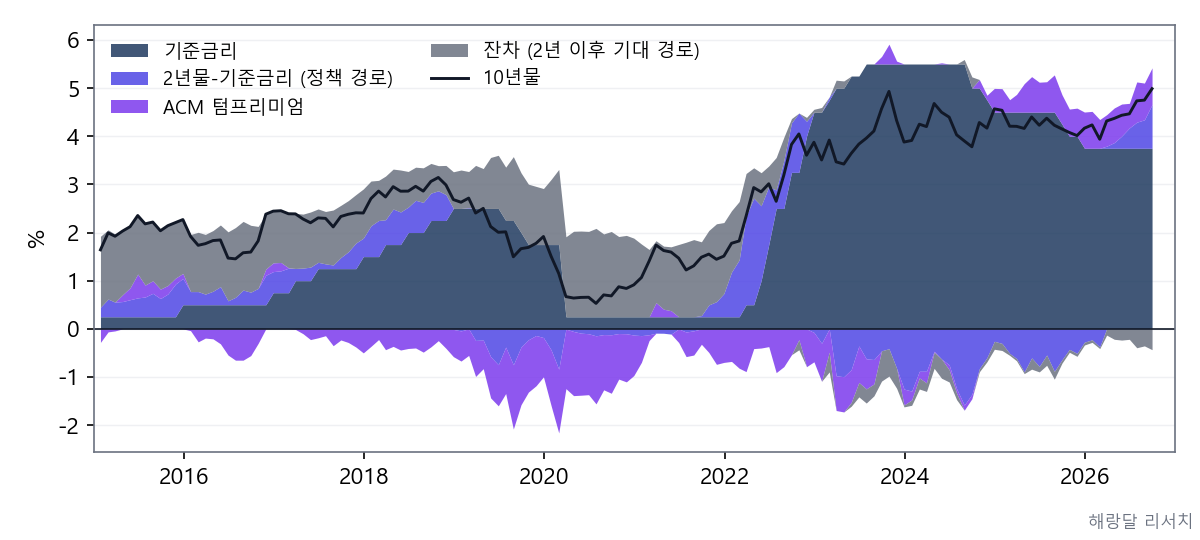
The 2-year at 4.66% sits 0.91 percentage points above the upper bound of the policy rate, and at the end of August that gap was 0.59 percentage points. Last December the 2-year was 0.28 percentage points below the policy rate instead, so what the market expects the Fed to add has grown by 1.19 percentage points in nine months.
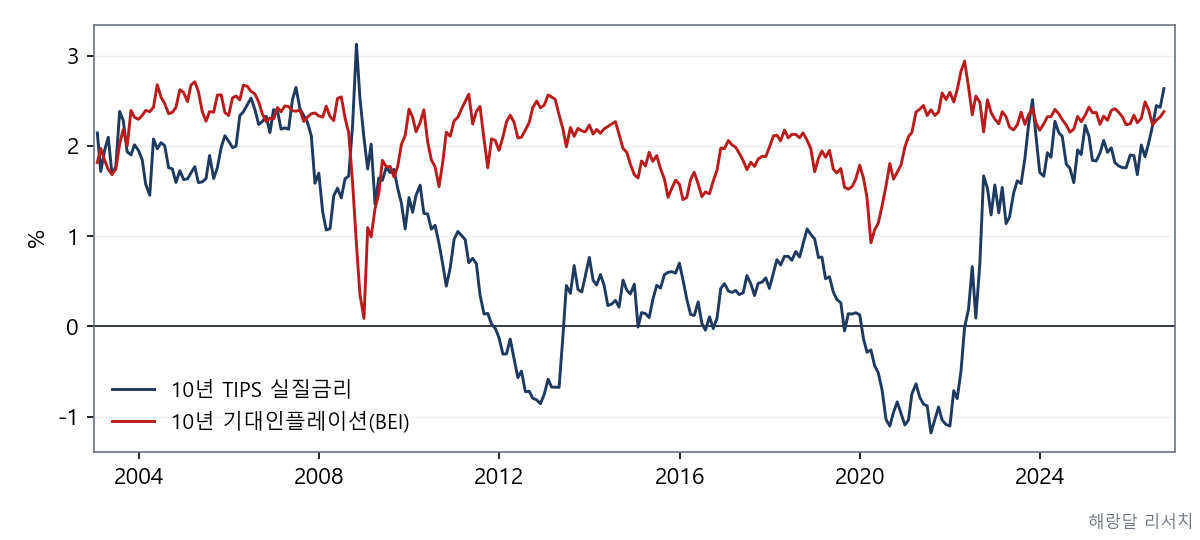
The yield on 10-year inflation-linked Treasuries is the real yield that is left once inflation is taken out, and it stands at 2.64% today. That is close to the highest reading since 2003 and the highest since October 2008.
Of the 0.82 percentage points the 10-year has added since last December, 0.74 percentage points belong to that real yield, while inflation expectations moved up only 0.12 percentage points. What works directly on the discount rate in equity valuation is the real yield, so a rise of the same size weighs on price multiples more heavily now than it did in 2021 and 2022.
| Date | 10-year | Policy rate upper bound | 2-year minus policy rate | Expected path beyond two years | |
|---|---|---|---|---|---|
| 2025.12 | 4.17 | 3.75 | −0.28 | 0.75 | −0.06 |
| 2026.06 | 4.47 | 3.75 | +0.42 | 0.51 | −0.22 |
| 2026.08 | 4.75 | 3.75 | +0.59 | 0.76 | −0.35 |
| 2026.09.14 | 4.99 | 3.75 | +0.91 | 0.76 in August | −0.43 |
Date
2025.12
- 10-year
- 4.17
- Policy rate upper bound
- 3.75
- 2-year minus policy rate
- −0.28
- Term
- 0.75
- Expected path beyond two years
- −0.06
Date
2026.06
- 10-year
- 4.47
- Policy rate upper bound
- 3.75
- 2-year minus policy rate
- +0.42
- Term premium
- 0.51
- Expected path beyond two years
- −0.22
Date
2026.08
- 10-year
- 4.75
- Policy rate upper bound
- 3.75
- 2-year minus policy rate
- +0.59
- Term premium
- 0.76
- Expected path beyond two years
- −0.35
Date
2026.09.14
- 10-year
- 4.99
- Policy rate upper bound
- 3.75
- 2-year minus policy rate
- +0.91
- Term premium
- 0.76 in August
- Expected path beyond two years
- −0.43
Table 1. Breaking down the US 10-year (%, percentage points). The term premium is current only through the end of August, so the September row holds the August value and fills what is left over into the expected path beyond two years.
Table 1 splits the 10-year into four pieces, which are the policy rate, the gap between the 2-year and the policy rate, the term premium, and the expected path beyond two years. That last piece is what the first three leave unexplained, and it carries how the market sees the rate path once two years have passed.
Between last December and August the term premium moved 0.01 percentage points while the gap between the 2-year and the policy rate widened 0.87 percentage points, and by September that gap had reached 0.91 percentage points. A term premium of 0.76% sits a little below where it usually runs when measured from 1990 onward, and the usual level is about 0.97%.
The explanation that deficits and government bond supply pushed long yields up does not fit this move, because the compensation for holding long bonds over time has not grown. The one thing the market changed is its view of how far the Fed will go over the next two years.
A negative reading in the expected path beyond two years means the market prices falling rates in that stretch, and the path it draws climbs into the middle of the 4% range before coming back down. What made the 10-year 5% is the hiking path the market expects from the Fed.