The $20B increase in Amazon's 2026 capex guidance is memory unit pricing. Yet the AWS operating margin hit a record 39.4% in the same quarter. When costs rise and the margin rises with them, selling prices rose faster, and compute rental pricing turning off its trough is the substance behind that price. There is a case for reading −$7.6B of free cash flow as a trough recorded before the price increase lands.
Reader's Brief — 30-second TL;DR
Advanced
Why Now
Second-quarter results released after the US close on 2026-07-30. AWS grew 36.7%, its fastest in 18 quarters, at a record 39.4% margin; backlog rose from $364B to $496B; and 2026 capex guidance was raised from $200B to $220B. The stock rose roughly 9% after hours.
Winners ?? Losers
Gaining certainty - operators renting out compute, with rental pricing up roughly 40% off the trough and on-demand capacity sold out; memory suppliers, since the capex increase is a direct unit-price upgrade to their revenue; the power value chain as the volume bottleneck behind the price bottleneck. Taking on more burden - end tenants renting compute, facing renewal at 1.5 to 2 times prior pricing; and net-income-based valuation metrics, invalidated by $53.4B of non-operating pre-tax income.
Watch For
Whether the AWS margin holds in the 39% range at Amazon's Q3 results on October 30, the single confirmation indicator for the pass-through, then NVIDIA results in late August, then a confirmed filing on the Anthropic AWS commitment in September or October, then the memory price assumption embedded in first 2027 capex guidance in the fourth quarter, and bond issuance terms and credit spreads through the year.
Reading depth
AWS — Five Straight Quarters of Acceleration and a 39.4% Margin
AWS revenue of $42.23B grew 36.7% year over year. Jassy called it the fastest growth in 18 quarters. The quarterly trajectory runs 18% in the second quarter of 2025, then 20%, 24%, 28%, now 37%. Five consecutive quarters of acceleration.
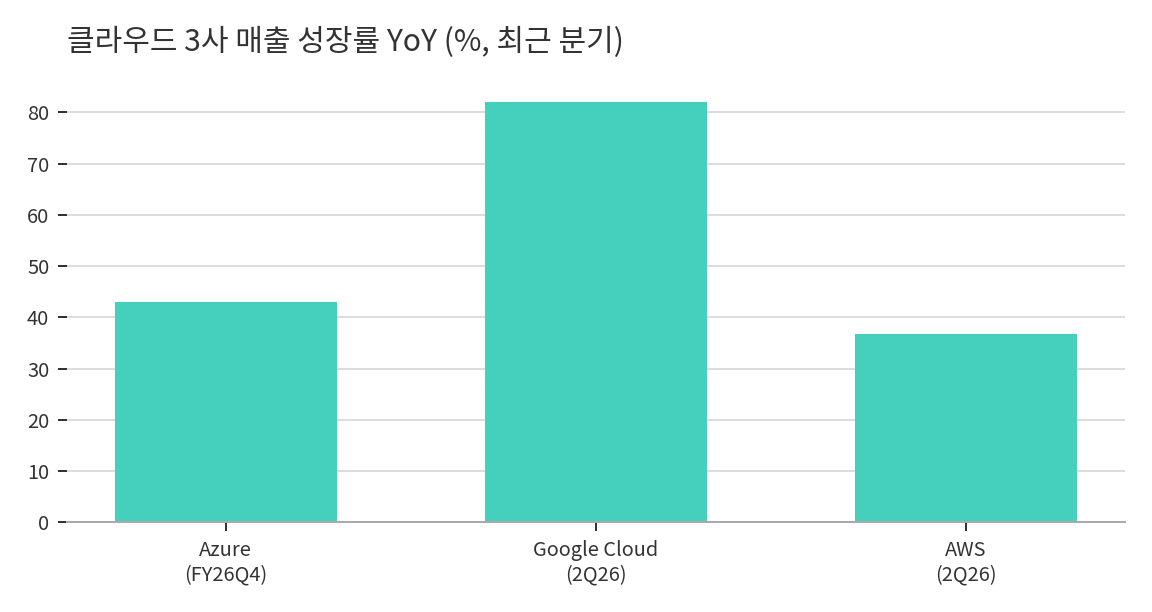
Chart 2. Cloud revenue growth YoY at the three largest providers, latest reported quarter — Azure FY26 Q4 +43%, Google Cloud Q2 2026 +82%, AWS Q2 2026 +36.7%
Chart 2. Cloud revenue growth YoY at the three largest providers, latest reported quarter — Azure FY26 Q4 +43%, Google Cloud Q2 2026 +82%, AWS Q2 2026 +36.7%
On growth alone AWS is not the fastest cloud. Google Cloud grew 82% in the same quarter and Azure grew 43% in constant . Oracle Cloud Infrastructure grew 93% in its fiscal quarter ended in May. That comparison ignores the denominator. AWS runs at a $169B annualized rate, the largest of the group. The absolute incremental dollars produced by 36.7% growth still lead.
Quarter
AWS
Azure (constant currency)
Google Cloud
Q2 2025
+18%
+39%
+32%
Q3 2025
+20%
+39%
+34%
Q4 2025
+24%
+38%
+48%
Q1 2026
+28%
+39%
+63%
Q2 2026
+37%
+43%
+82%
Quarter
Q2 2025
AWS
+18%
Azure (constant currency)
+39%
Google Cloud
+32%
Quarter
Q3 2025
AWS
+20%
Azure (constant currency)
+39%
Google Cloud
+34%
Quarter
Q4 2025
AWS
+24%
Azure (constant currency)
+38%
Google Cloud
+48%
Quarter
Q1 2026
AWS
+28%
Azure (constant currency)
+39%
Google Cloud
+63%
Quarter
Q2 2026
AWS
+37%
Azure (constant currency)
+43%
Google Cloud
+82%
Microsoft is on a June fiscal year, so its fiscal quarters are aligned to calendar quarters here. Azure has no standalone reported revenue, only a growth rate, shown in constant currency.
The three trajectories point the same way. AWS had been stalled around 20% through mid-2025 before it accelerated, and the others climbed over the same period. One table is enough to establish that demand has turned.
Profitability is the sharper story. AWS operating income of $16.62B rose 63% from $10.16B. A 39.4% margin was delivered straight through the depreciation load of a capex surge. Cloud margins usually compress in this phase. AWS went the other way.
What matters here is not the level of the margin but its direction. If depreciation is climbing and component prices are rising while the margin sets a record, then price and mix rose faster still. The substance behind that price is compute pricing.
AWS has both scale and acceleration, and the fact that its margin rose while depreciation was climbing is the most important piece of information in this quarter's P&L.
Compute Rental Pricing — The Price Side Has Turned
Key Points
—Compute rental pricing has turned off its trough, and the memory unit costs loaded into capex are on the path into that price.
The compute rental market was an unambiguous buyer's market through 2024 and 2025. Hourly rental pricing for training-class GPUs fell from roughly $7-10 in early 2024 to $2-4 by the end of 2025, a decline of 50-70%. Amazon itself cut GPU instance pricing by 44% in June 2025.
The regime changed. One-year contract rental pricing rose roughly 40% in the five months from a trough in the autumn of 2025 to March 2026, and on-demand capacity is effectively sold out across GPU types. Tenants have also stopped returning secured capacity to the pool. It became a seller's market.
This vector has to be read as a pair with the capex raise. Amazon pays a unit price for memory and charges a unit price for compute rental at the same time. Memory inflation is not a cost that ends at this company; it is a cost that passes through. The evidence that the pass-through works is already in the P&L: the AWS margin hit a record in the very phase where depreciation is climbing fastest.
Contract renewals sit on top of this. The long-term commitments struck during the cheap phase of 2024 and 2025 come due in sequence. If that volume is renewed at today's rates, contract pricing lands at 1.5 to 2 times the old level. Part of the market has already begun pricing that assumption in, and on that view free of −$7.6B is not a floor but a trough recorded before the price increase lands. The roughly 9% move in after-hours trading is a price with some of that assumption inside it.
It is an assumption, and that should be stated plainly. The renewal multiple has not been confirmed in any disclosure. Which is why the verification path matters.
The destination of the pass-through should also be stated plainly. Amazon does not absorb all of the memory increase, and it does not pass all of it on either. Memory suppliers and cloud operators split the inflation between them, and the pure payer is the end tenant renting the compute.
Compute rental pricing has turned off its trough, and the memory unit costs loaded into capex are on the path into that price.
Backlog — Contracted Revenue Is the Leading Indicator for Cash Flow
Key Points
—A $496B backlog is more than twice the capex guidance, and it is the baseline for judging when the free cash flow deficit gets recovered.
AWS backlog rose from $364B a quarter earlier to $496B, a quarterly increment of $132B.
Cloud Remaining Contract Value — Latest Disclosure
Microsoft is commercial RPO; Oracle is remaining performance obligations at the fourth quarter of its May fiscal year; Google Cloud and AWS are Q2 2026 backlog
Backlog is contracted value not yet recognized as revenue. In a structure where capex goes out first and revenue arrives later, it is the leading indicator for how fast a free cash flow deficit gets recovered. Add the four providers together and remaining contract value exceeds $2.3 trillion.
For Amazon alone, a $496B backlog is more than twice the $220B capex guidance for 2026. Current spending is not speculative buildout without contracts behind it. The question is the price at which that backlog converts into revenue, and the rebound in compute rental pricing is landing on exactly that price.
The driver of the jump is Anthropic. In April 2026 Amazon and Anthropic jointly announced an AWS compute commitment of roughly $100B. That figure has not yet been confirmed in a company filing. The physical base for the commitment is Project Rainier, a very large Trainium cluster dedicated to Anthropic.
The backlog carries a question in the other direction. AWS built its franchise on long-tail diversification across millions of accounts, from startups to governments, which diluted the risk of any single customer leaving. This cycle is changing that mix. The core of the backlog increment comes from a single lab, and the marginal contribution to growth is shifting from the tail to the head. The quantitative check is the customer concentration note in the quarterly and annual filings, and whether a single customer crosses the 10% threshold.
A $496B backlog is more than twice the capex guidance, and it is the baseline for judging when the free cash flow deficit gets recovered.
Full access requires a free account
Sign in with Google to unlock the full body of every free report instantly.
This site runs on ads — the tier system rewards community contributions.
Comments
This report is provided for informational purposes only and does not constitute a recommendation to buy or sell any financial instrument. Investment decisions should be made based on your own judgment and responsibility. The analysis and opinions contained herein are based on information available at the time of writing and are subject to change.