Alphabet — How the Rebound in H100 Rental Prices Redraws Hyperscaler Cash Flow
Reading the second quarter of 2026 across five axes — operating cash flow, capex, free cash flow, cloud growth and backlog — and why contracts locked in at the bottom coming up for renewal is the case for a re-rating
Alphabet's turn to negative free cash flow in the second quarter is a change in funding method rather than a retreat in the business, and the rebound in compute rental pricing works to shorten how long that change lasts. With the one-year contracted H100 rate up about 40% off its floor in five months and on-demand sold out, cheap commitments reaching maturity and renewing at 1.5–2 times the trough would raise unit revenue with no incremental capex. **Alphabet is the operator where that path is least printed into results, and that is room not yet used rather than a weakness.**
Reader's Brief — 30-second TL;DR
Advanced
Why Now
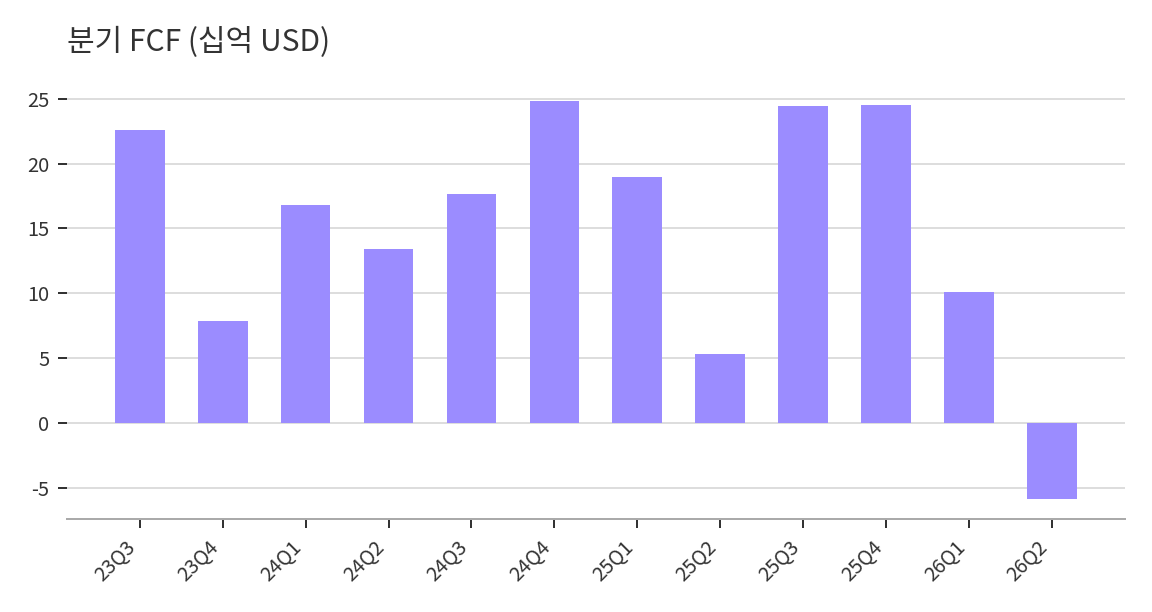
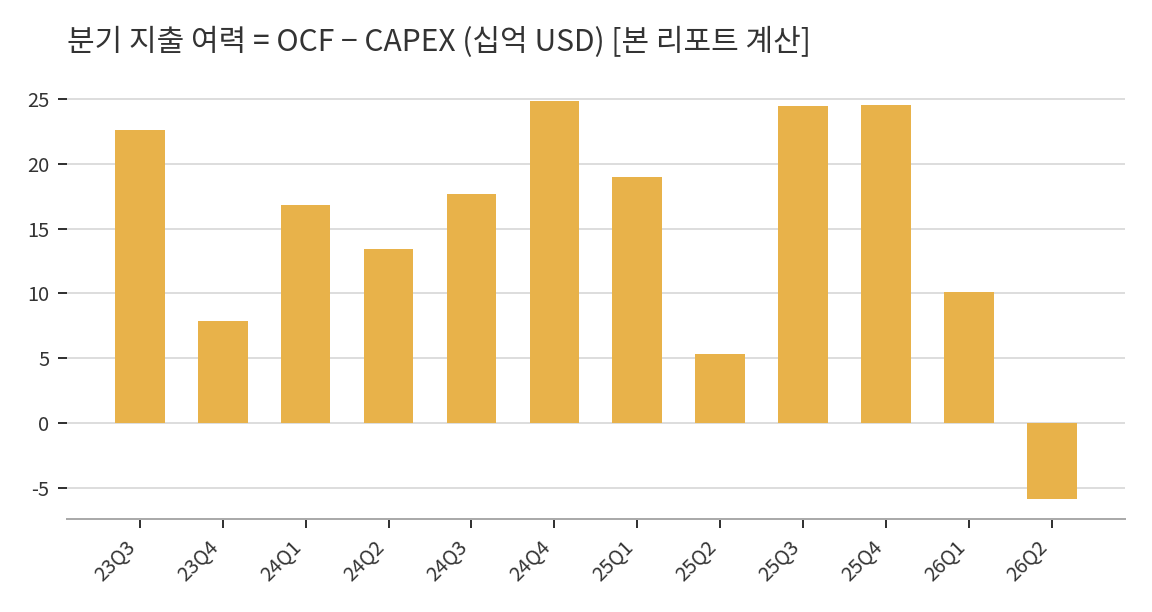
Second-quarter results delivered revenue of $119.8 billion (+24%), Google Cloud revenue of $24.8 billion (+82%) and cloud operating income of $8.8 billion (3.1 times the prior year), but capex of $44.92 billion exceeded operating cash flow of $39.07 billion and free cash flow fell to negative $5.86 billion, the first negative quarter since the IPO. Capex guidance for 2026 was raised again to $195–205 billion. Amazon and Meta saw cash flow compressed in the same earnings season, while the compute rental index rebounded about 40% from its October 2025 floor.
Winners ?? Losers
Where the room for re-rating widens — cloud providers with a large installed base and a high share of cheap commitments, since renewal pricing converts to revenue with no incremental capex; net cash balance sheets that can keep spending without raising funds; custom silicon stacks that buy more compute per dollar of capex; memory suppliers, since custom chips carry the same high bandwidth memory. Where the burden stays — operators that financed GPUs on someone else's credit, facing clustered 2026–2028 maturities and a widening ratings split; the depreciation curve, whose $15–25 billion annual increment races a $24 billion annual increment in cloud profit; and the absence of forward guidance, which discounts every capex raise.
Watch For
Direction of operating cash flow in Alphabet's third-quarter results on October 29 (that line, not the growth rate) → whether the quarterly compute rental index keeps rebounding → first recognition of AI rental revenue in mining-conversion operators' August filings → the spread on a first large corporate bond issue in the fourth quarter → whether the useful-life policy changes in the year-end annual report.
Reading depth
The Five Axes, Measured — Operating Cash Flow, Capex, Free Cash Flow, Growth, Backlog
Start with twelve quarters at one company. Revenue operating income never stopped climbing. Only free changed direction.
Quarter
Revenue
Operating income
Capex
Operating cash flow
Free cash flow
3Q 2023
76.69
21.34
8.05
30.66
22.60
4Q 2023
86.31
23.70
11.02
18.91
7.90
1Q 2024
80.54
25.47
12.01
28.85
16.84
2Q 2024
84.74
27.43
13.19
26.64
13.45
3Q 2024
88.27
28.52
13.06
30.70
17.64
4Q 2024
96.47
30.97
14.28
39.11
24.84
1Q 2025
90.23
30.61
17.20
36.15
18.95
2Q 2025
96.43
31.27
22.45
27.75
5.30
3Q 2025
102.35
31.23
23.95
48.41
24.46
4Q 2025
113.83
35.93
27.85
52.40
24.55
1Q 2026
109.90
39.70
35.67
45.79
10.12
2Q 2026
119.80
40.77
44.92
39.07
-5.86
Quarter
3Q 2023
Revenue
76.69
Operating income
21.34
Capex
8.05
Operating cash flow
30.66
Free cash flow
22.60
Quarter
4Q 2023
Revenue
86.31
Operating income
23.70
Capex
11.02
Operating cash flow
18.91
Free cash flow
7.90
Quarter
1Q 2024
Revenue
80.54
Operating income
25.47
Capex
12.01
Operating cash flow
28.85
Free cash flow
16.84
Quarter
2Q 2024
Revenue
84.74
Operating income
27.43
Capex
13.19
Operating cash flow
26.64
Free cash flow
13.45
Quarter
3Q 2024
Revenue
88.27
Operating income
28.52
Capex
13.06
Operating cash flow
30.70
Free cash flow
17.64
Quarter
4Q 2024
Revenue
96.47
Operating income
30.97
Capex
14.28
Operating cash flow
39.11
Free cash flow
24.84
Quarter
1Q 2025
Revenue
90.23
Operating income
30.61
Capex
17.20
Operating cash flow
36.15
Free cash flow
18.95
Quarter
2Q 2025
Revenue
96.43
Operating income
31.27
Capex
22.45
Operating cash flow
27.75
Free cash flow
5.30
Quarter
3Q 2025
Revenue
102.35
Operating income
31.23
Capex
23.95
Operating cash flow
48.41
Free cash flow
24.46
Quarter
4Q 2025
Revenue
113.83
Operating income
35.93
Capex
27.85
Operating cash flow
52.40
Free cash flow
24.55
Quarter
1Q 2026
Revenue
109.90
Operating income
39.70
Capex
35.67
Operating cash flow
45.79
Free cash flow
10.12
Quarter
2Q 2026
Revenue
119.80
Operating income
40.77
Capex
44.92
Operating cash flow
39.07
Free cash flow
-5.86
USD billions. Capex shown as an absolute figure.
Across twelve quarters went from $8.05 billion to $44.92 billion, a factor of 5.6. Operating cash flow over the same span went from $30.66 billion to $39.07 billion, a factor of about 1.3. The difference between those two slopes is the entire story of this quarter's negative number. Neither revenue nor profit was impaired.
This scissor is not one company's situation. Put the latest quarter for four companies side by side and the pressure, and the headroom, differ in size.
Company
Operating cash flow
Capex
Free cash flow
Alphabet (2Q 2026)
39.07
44.92
-5.86
Microsoft (FY26 Q4)
55.44
35.80
19.64
Amazon (2Q 2026)
45.39
54.21
-8.82
Meta (2Q 2026)
31.86
30.12
1.75
Company
Alphabet (2Q 2026)
Operating cash flow
39.07
Capex
44.92
Free cash flow
-5.86
Company
Microsoft (FY26 Q4)
Operating cash flow
55.44
Capex
35.80
Free cash flow
19.64
Company
Amazon (2Q 2026)
Operating cash flow
45.39
Capex
54.21
Free cash flow
-8.82
Company
Meta (2Q 2026)
Operating cash flow
31.86
Capex
30.12
Free cash flow
1.75
USD billions. Microsoft's fiscal year ends in June, and capex here is cash capex from the cash flow statement — a different definition from the capex-plus-finance-lease total the company uses in guidance.
Amazon posted negative $18.17 billion in the first quarter of 2026 and negative $8.82 billion in the second, with trailing twelve-month free cash flow at negative $7.6 billion against a positive $18.2 billion a year earlier. Meta's second-quarter free cash flow of $1.75 billion was down 81% from $9.02 billion a year before. The one company still generating comfortable surplus cash is Microsoft, whose different fiscal calendar puts it one beat out of phase in the capex surge.
Four companies are moving through the same stretch at once, and Alphabet's negative number is not the exception in that stretch but a sample of it.
Growth and backlog moved the other way
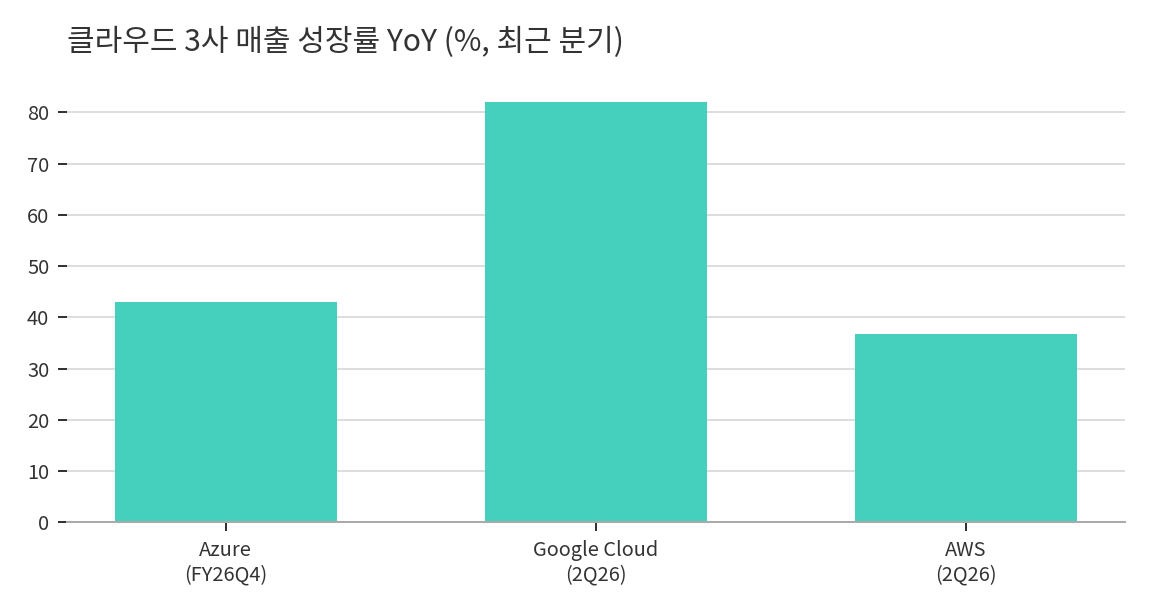
Chart 3. Cloud revenue growth, year over year, latest quarter (%)
Chart 3. Cloud revenue growth, year over year, latest quarter (%)
While cash flow was compressed, every revenue-side indicator went up.
Quarter
Google Cloud
AWS
Azure (constant currency)
Oracle Cloud Infrastructure
Five quarters ago
+28%
+17%
+35%
+49%
Four quarters ago
+32%
+18%
+39%
+52%
Three quarters ago
+34%
+20%
+39%
+55%
Two quarters ago
+48%
+24%
+38%
+68%
One quarter ago
+63%
+28%
+39%
+84%
Latest quarter
+82%
+37%
+43%
+93%
Quarter
Five quarters ago
Google Cloud
+28%
AWS
+17%
Azure (constant currency)
+35%
Oracle Cloud Infrastructure
+49%
Quarter
Four quarters ago
Google Cloud
+32%
AWS
+18%
Azure (constant currency)
+39%
Oracle Cloud Infrastructure
+52%
Quarter
Three quarters ago
Google Cloud
+34%
AWS
+20%
Azure (constant currency)
+39%
Oracle Cloud Infrastructure
+55%
Quarter
Two quarters ago
Google Cloud
+48%
AWS
+24%
Azure (constant currency)
+38%
Oracle Cloud Infrastructure
+68%
Quarter
One quarter ago
Google Cloud
+63%
AWS
+28%
Azure (constant currency)
+39%
Oracle Cloud Infrastructure
+84%
Quarter
Latest quarter
Google Cloud
+82%
AWS
+37%
Azure (constant currency)
+43%
Oracle Cloud Infrastructure
+93%
Each company's own fiscal quarters. Microsoft discloses no standalone Azure revenue, only a constant-currency growth rate. Oracle's fiscal year ends in May and the figures here are infrastructure alone; total cloud including applications grew 47% in the same quarter.
All four accelerated without exception. Google Cloud accelerated the hardest of them. Its absolute revenue also doubled in six quarters, from $12.3 billion to $24.8 billion.
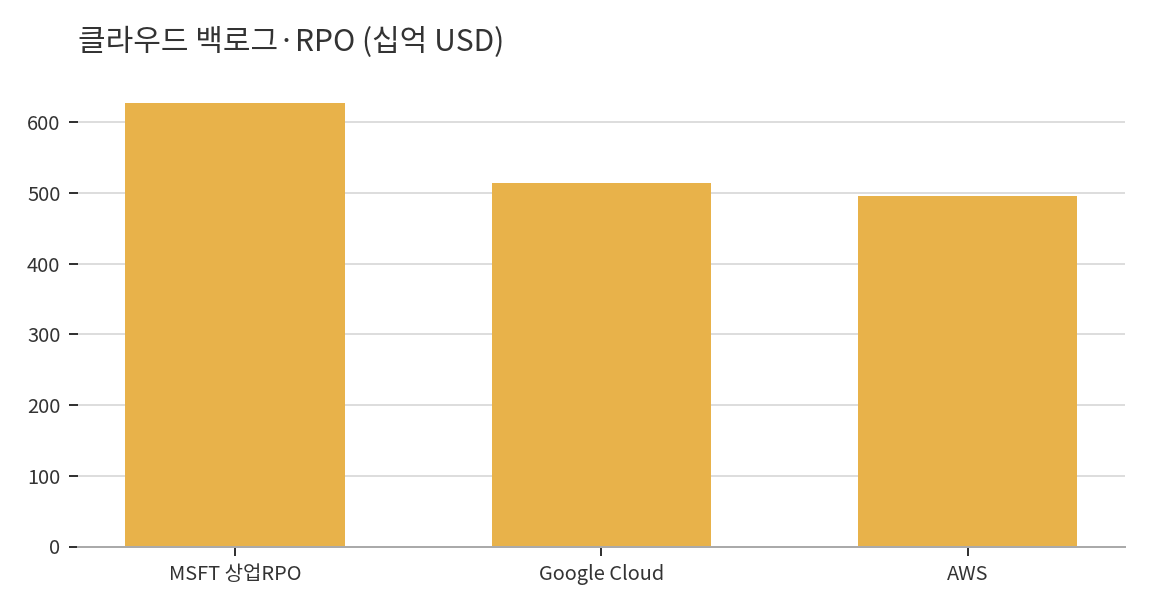
Chart 4. Cloud backlog and remaining performance obligations (USD billions)
Chart 4. Cloud backlog and remaining performance obligations (USD billions)
Backlog — work not yet recognized as revenue — is more dramatic still. Microsoft's commercial remaining performance obligations reached $678 billion, up 84% year over year, having grown from $392 billion to $678 billion within a single fiscal year. Oracle's remaining obligations stand at $638 billion, up 363%. Google Cloud is at $514 billion after adding more than $50 billion in one quarter, and AWS is at $496 billion after adding $132 billion from $364 billion the quarter before.
Google Cloud's $514 billion is more than five times its latest quarter annualized. When those contracts convert to revenue, and at what price, decides the other four axes.
Cash flow compressed while growth and backlog jumped at the same time. When two pictures look inconsistent, it means a variable is missing from the arithmetic — and here that variable is price.
Google Cloud at 82% — The Quarter Growth Turned Into Profit
Google Cloud revenue came to $24.8 billion, up 82%. That is 19 percentage points of acceleration from 63% the prior quarter. The six-quarter path reads 28%, 32%, 34%, 48%, 63%, 82%. The business is getting bigger and growing faster at the same time.
Profit matters more than the growth rate. Cloud operating income went from $2.8 billion to $8.8 billion in a year, a factor of 3.1. Revenue rose $11.2 billion and operating income rose $6.0 billion, so the incremental operating margin is above 50%. That single line is the strongest counterexample to the claim that AI cloud adds revenue but never profit.
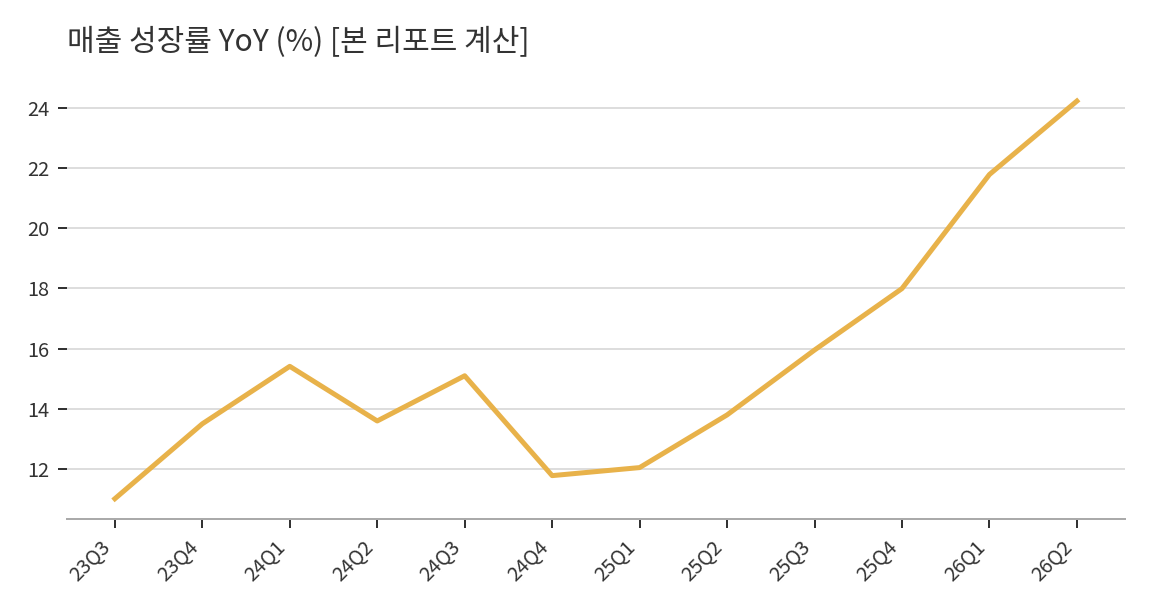
Chart 5. Alphabet quarterly revenue growth, year over year (%)
Chart 5. Alphabet quarterly revenue growth, year over year (%)
Company-wide revenue rose 24% to $119.8 billion and operating income came to $40.8 billion at a 34% margin. Even with capex doubling, the income statement itself was not impaired. The advertising complex still accounts for roughly three quarters of total revenue and remains the source of the cash that pays for the buildout.
The quality of the backlog
The $514 billion backlog came with qualitative markers attached. New customer acquisition is running at more than twice the prior year's pace, and existing customers are consuming more than 50% above their committed amounts. That overage is the important signal. It means actual usage is running ahead of what was assumed at signing, and it means the leverage to renegotiate both size and unit price at accumulates on the provider's side.
Backlogs should not be added together, though. When the same lab contracts with several clouds, the same spending lands in more than one provider's backlog. How much of the Anthropic commitment sits inside Google Cloud's $514 billion and how much inside AWS's $496 billion is not disclosed.
Evidence from the physical layer — 22 billion tokens per minute
Chief executive Sundar Pichai disclosed throughput of 22 billion tokens per minute, up 37% from the prior quarter. Revenue can be smoothed by accounting; token throughput is direct evidence that the equipment is actually running and the load is growing. Read alongside the remark that the company remains supply constrained, the present state is shortage, not glut.
In a market that is short of supply, prices rise. That sentence runs through the rest of this report.
Custom silicon — the seventh-generation Ironwood
What defines this company's capex efficiency is its own chip, the TPU (tensor processing unit). By the seventh-generation Ironwood, most internal workloads and part of the external customer base run on in-house silicon. It is the only complete stack held inside one company from chip design through compiler, model and serving, which keeps margin that would otherwise go to an accelerator vendor. That is a structural cost advantage: more compute for the same dollar.
External validation arrived as well. Anthropic signed an agreement for access to up to one million TPUs. Large-scale adoption by a competing frontier lab, rather than by the in-house model team, is what establishes commercial marketability for the silicon.
Growth rate, the turn to profit, and the quality of the backlog were all best-in-class in the same quarter, and all of that strength came from the physical layer where the equipment actually runs.
The Turn in the Compute Rental Market — Prices Rising Off the Floor
Now to price. The compute rental market has passed through two phases over the past two years and is now in a third.
The first phase was the collapse. The one-year contracted rental rate for Nvidia's H100 fell from roughly $8 an hour in the glut to $1–2. A separately compiled ledger puts the same series at $7–10 an hour in early 2024 falling to $2–4 by the end of 2025, a decline of 50–70%. A major cloud provider cut GPU instance prices by as much as 44% in June 2025. Contracts signed in that window make up a large share of the current installed base.
The second phase was the floor. The one-year contracted index bottomed at $1.70 an hour in October 2025.
The third is now. That index reached $2.35 by March 2026, up about 40% in five months, and on-demand capacity is effectively sold out across accelerator types. Tenants have also stopped returning secured capacity to the pool. Compute has moved from a buyer's market to a seller's market.
The funding market tells the same story
A price index alone is thin evidence for a phase change. But the terms available to those who borrow against GPUs moved in the same direction.
In March 2026 a GPU cloud operator raised $8.5 billion against GPUs and customer contracts and was rated Moody's A3 and DBRS A(low). It was the first investment-grade rating on a GPU-backed structure, at an effective borrowing cost of about 5.9%. Borrowing against the same collateral in August 2023 carried a floating rate of roughly 15%, so nine percentage points came out. In June 2026 another operator raised $3.65 billion at a Fitch A rating and a blended 6.00%, covering 96% of the GPU capital spending attached to a contract with a large customer in a single transaction.
Lenders have started to price the rental cash flow coming off GPUs as far more dependable collateral than before. Collateral becoming more valuable and rents going up are two faces of the same event.
It is not a uniform benefit
The other side has to stay on the page. Even within GPU-backed structures ratings split as low as Ba2 and BB+, and high-yield issues carrying coupons of 6.75–9.25% sit alongside them. Between 2026 and 2028 there is a refinancing window where GPU-backed maturities cluster, and total GPU-backed debt in this segment is estimated above $20 billion. The stress case in which residual values for the H100 generation fall 30–50% below acquisition cost also remains live.
In other words, a rebound in rental rates does not rescue every operator equally. The side that builds with its own cash and does not borrow anyone else's credit captures this phase most completely.
The price of compute is in a rising phase off the floor, and that fact is still largely absent from the reported results of the side collecting the rent.
Full access requires 🥉 Bronze tier
Sign in with Google — your tier will be checked automatically and access granted if eligible.
This site runs on ads — the tier system rewards community contributions.
Comments
This report is provided for informational purposes only and does not constitute a recommendation to buy or sell any financial instrument. Investment decisions should be made based on your own judgment and responsibility. The analysis and opinions contained herein are based on information available at the time of writing and are subject to change.