The Unwind of Japanese Money — How Yen Strength Travels Into US Treasuries and Risk Assets
A joint US-Japan intervention at a four-decade low, a rate gap collapsing from the Japanese side, and the changed composition of a 2.5160 trillion dollar stock — the sequence of the unwind and where to confirm it
The money that left Japan over the past decade and a half bought American growth, not American yield. Of 2.5160 trillion dollars in US long-term securities, 975 billion — 39 percent — is equities. Which is why the consequences of an unwind appear first in the equity market rather than the bond market. The rate gap is collapsing from the Japanese side rather than the American side, and on top of it sits short-term positioning twice as thick as it was immediately before the 2024 break. And what pulled the trigger this time was not a market shock but the authorities.
Reader's Brief — 30-second TL;DR
Advanced
Why Now
USD/JPY printed 163.94 in the last week of July, the weakest yen in forty years. Verbal intervention from the US Treasury Secretary came Thursday, Japan spent 8.45 trillion yen the same day in the largest single-day intervention on record, and Washington entered directly on Friday, with the New York Fed selling euros it held and buying yen. It is the first time the United States has entered on the yen-buying side since 1998, twenty-eight years ago. The rate closed Friday in New York at 157.40.
Winners ?? Losers
Under greater pressure — the 975 billion dollars of Japanese-held US equities with little currency hedging, the AI infrastructure funding chain that runs on credit (Oracle's five-year default protection at an all-time high), and the large-cap technology and semiconductor complex where carry money was stacked. Under less pressure — Japanese domestic purchasing power under a stronger yen, and domestic bonds held by Japanese institutions whose reinvestment yields rise with local rates.
Watch For
US futures yen positioning every Friday (the intervention week's liquidation is the first scorecard — a drop below 100,000 contracts within two weeks is an orderly retreat, while holding above 140,000 is a renewed challenge) → Japan's weekly outbound securities investment every Thursday (whether foreign bonds and equities turn to net selling together) → euro-yen approaching the 186 area as the second intervention observation point → the Bank of Japan's September meeting for the policy gap narrowing to 2.5 percentage points → life insurer second-half investment plans in October and November for hedge ratio intentions
Reading depth
The Rate Gap — This Time It Is Collapsing From the Japanese Side
The reason Japanese money went abroad for thirty years is simple. Japan's rates were zero and America's were not. Holding yen paid nothing. Converting to dollars and buying US bonds paid something.
That reason is now disappearing.
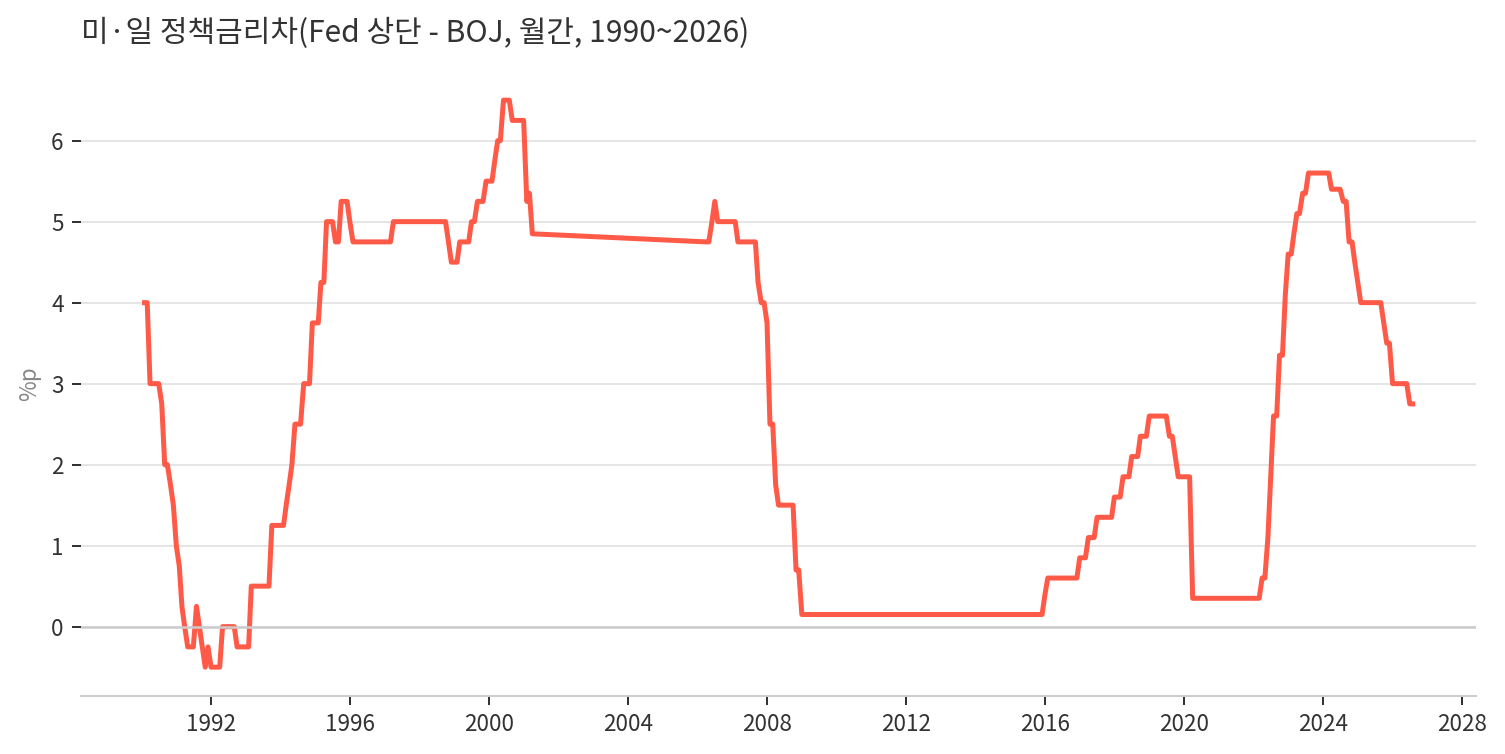
Chart 2. US-Japan policy rate gap (Fed upper bound minus BOJ, monthly, 1990–2026) — narrowed from 5.6 points in 2023 to 2.75 points
Chart 2. US-Japan policy rate gap (Fed upper bound minus BOJ, monthly, 1990–2026) — narrowed from 5.6 points in 2023 to 2.75 points
The policy rate gap has been cut in half, from 5.6 percentage points in 2023 to 2.75 points. The upper bound of the US target range is 3.75 percent. Japan's is 1.00 percent.
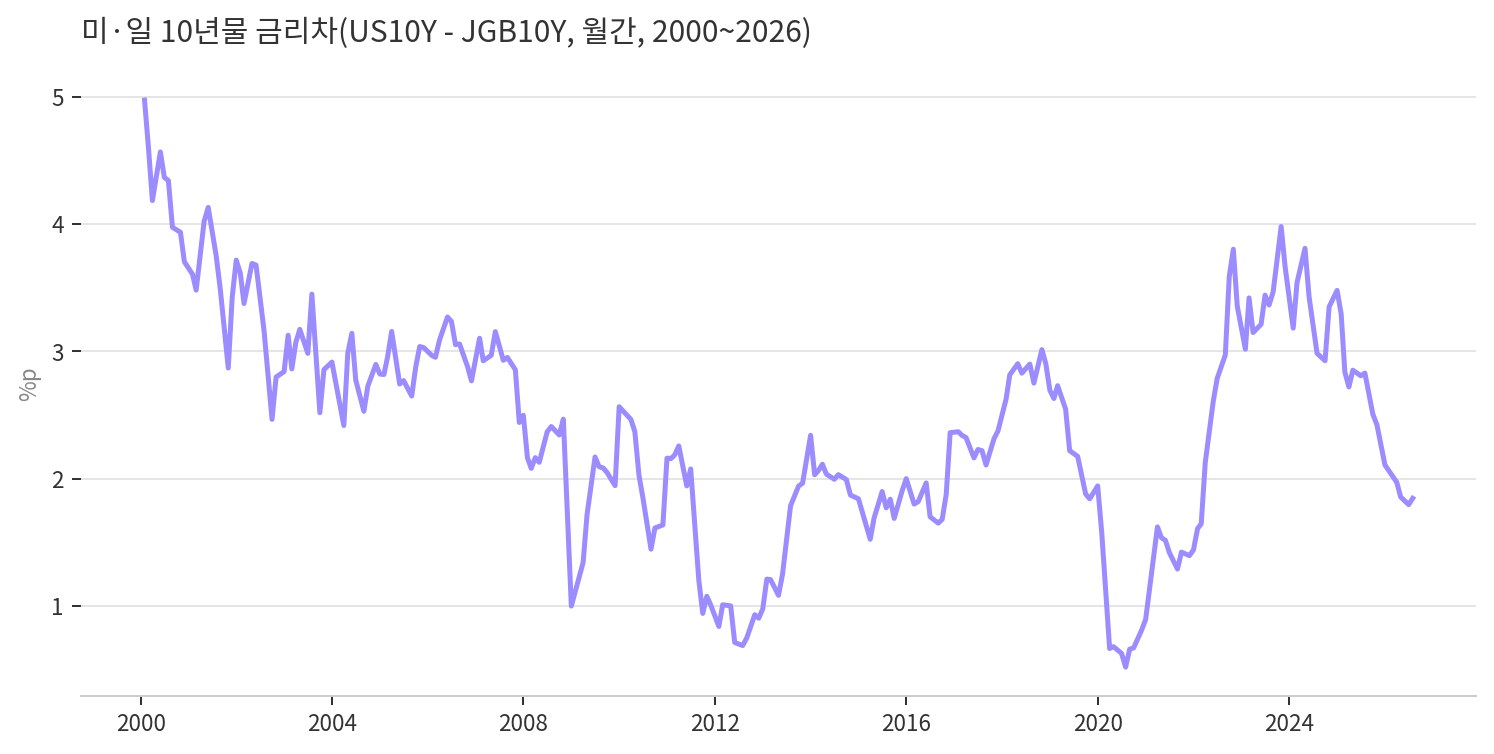
Chart 3. US-Japan 10-year yield gap (monthly, 2000–2026) — now below 2 percentage points
Chart 3. US-Japan 10-year yield gap (monthly, 2000–2026) — now below 2 percentage points
The ten-year gap is more dramatic. From roughly 4 percentage points in 2023 it now sits below 2. As of July 30 the US ten-year was 4.68 percent and the Japanese ten-year 2.80 percent. The gap is 1.88 points.
This gap has compressed sharply three times before: 2000–04, 2007–08, and 2019–20. The yen strengthened in all three. But all three compressions came from the Federal Reserve cutting.
This one is the opposite. It is compressing because Japan is hiking.
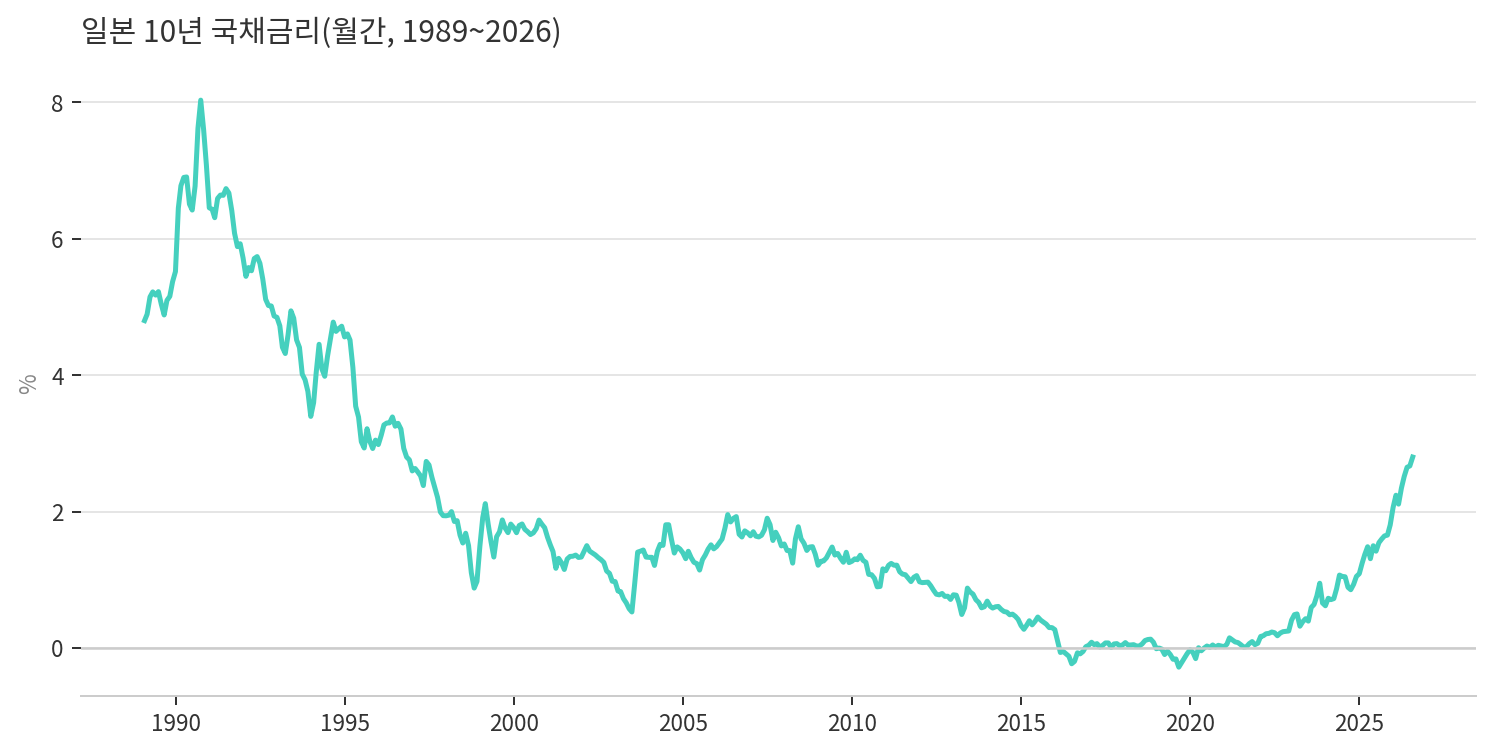
Chart 4. Japan 10-year government bond yield (monthly, 1989–2026) — a vertical climb from near zero to 2.80 percent
Chart 4. Japan 10-year government bond yield (monthly, 1989–2026) — a vertical climb from near zero to 2.80 percent
The Japanese ten-year sat pinned near zero until a few years ago. It is now 2.80 percent. On July 9 it reached 2.87 percent, the highest since May 1997 — a 29-year high.
Why this matters: the gap keeps eroding from the Japanese side whether or not the Federal Reserve cuts. It is a variable that runs independently of US monetary policy.
Then hedging costs sit on top of that.
The rate gap that was the reason for money to travel to America is vanishing because of Japan rather than America, and once hedging costs are added, US Treasuries are already a worse asset than Japanese ones for a Japanese investor.
The Design of the Intervention — Why Washington Sold Euros Instead of Dollars
The unusual feature of this intervention is what the United States sold. Not dollars. Euros.
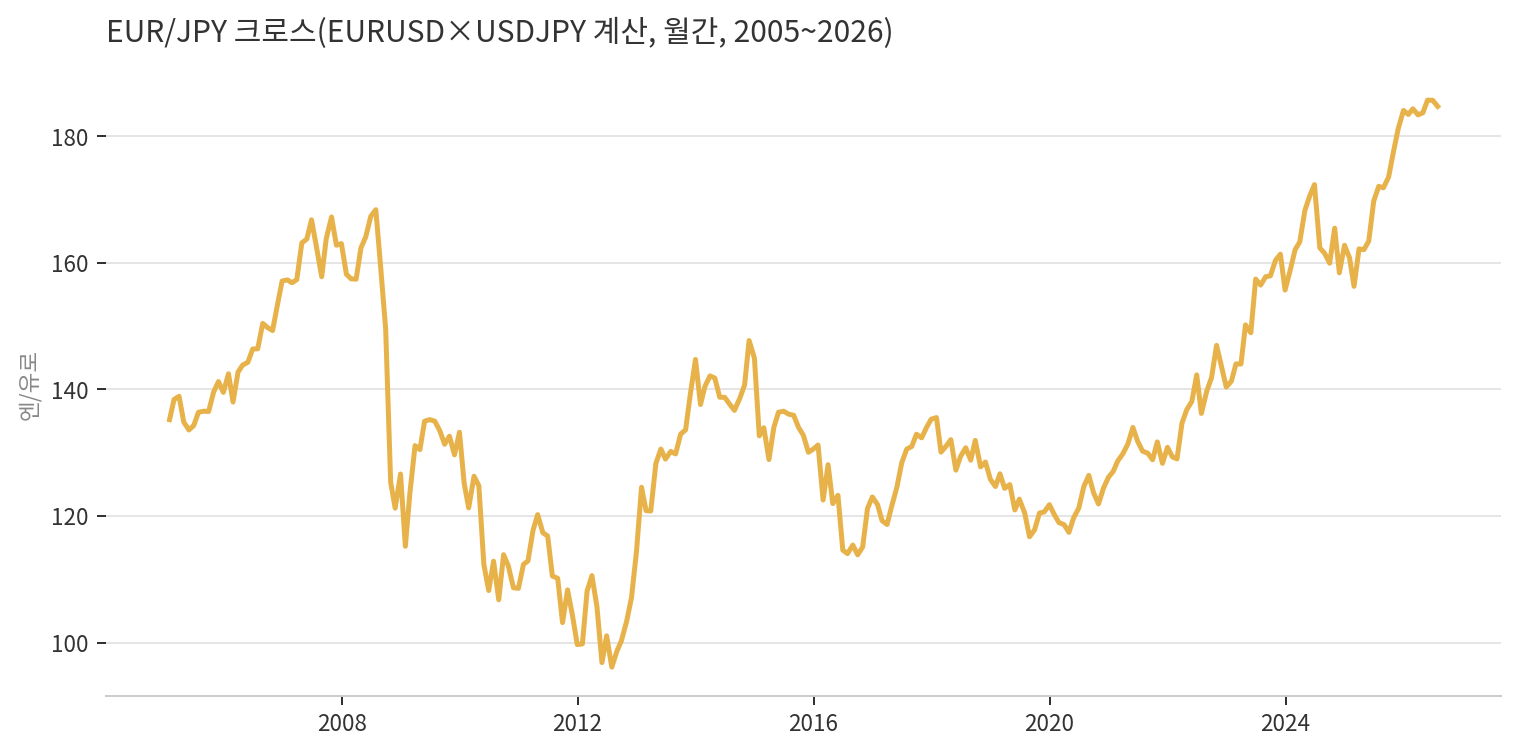
Chart 5. EUR/JPY cross (monthly, 2005–2026) — the weakest zone on record
Chart 5. EUR/JPY cross (monthly, 2005–2026) — the weakest zone on record
The reason sits in this chart. Against the euro the yen slid to 186.99 on July 30, the weakest zone on record. The yen was not merely cheap against the dollar. It was cheaper against the euro.
Defend only dollar-yen and the market detours through euro-yen to sell the yen again. Selling euros to buy yen closes that detour. As a bonus, Washington does not have to touch its own currency or its own bond market.
There is a limit, though. The euro reserves the US Treasury holds are finite. The ammunition for this method is not unlimited. The day after the intervention euro-yen came back to 184.04.
To see whether a second intervention is coming, watch euro-yen rather than dollar-yen, and the moment euro-yen approaches the 186 area again is the observation point.
Japan's Treasury Holdings — The Experiment Already Run in 2022
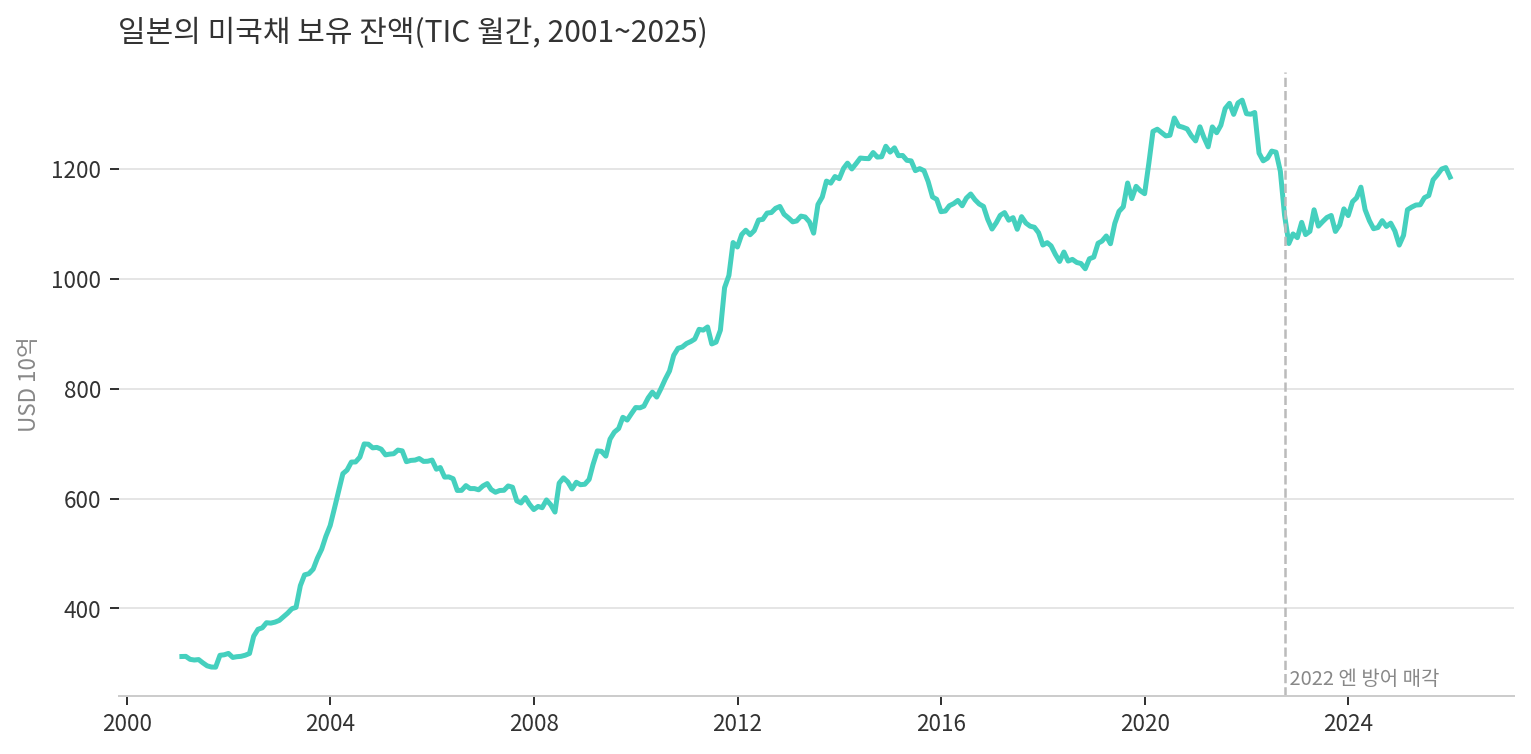
Chart 6. Japan's holdings of US Treasuries (monthly, 2001–2025, USD billions) — the dashed line marks the 2022 yen-defense selling window
Chart 6. Japan's holdings of US Treasuries (monthly, 2001–2025, USD billions) — the dashed line marks the 2022 yen-defense selling window
Japan holds 1.1855 trillion dollars of US Treasuries as of the end of 2025. That is 12.8 percent of the 9.2672 trillion dollars held by all foreign holders. The United Kingdom is second at 863.1 billion, a wide gap behind.
The part of this chart to study is 2022. During the period when Japan was defending the yen alone, holdings fell from 1.3030 trillion dollars in February to 1.0644 trillion in October. That is 238.6 billion dollars in eight months.
The logic is plain. Buying yen requires dollars. Those dollars come from selling Treasuries.
Over the same window the US ten-year yield went from 1.83 percent to 4.25 percent. The primary driver of that year's rate rise was of course Federal Reserve tightening. But the fact that the largest foreign holder stood on the sell side for eight straight months was a background condition of that rise.
This is one of the reasons Washington joined the intervention directly this time. When Japan defends alone, Treasuries get sold.
Where does it stand now? In the first quarter of 2026 Japanese investors were net sellers of 29.6 billion dollars of US Treasuries and agency paper. That is the largest quarterly sale since 2022. In the second quarter they turned back to buying. This is still not a one-way exit. It is a phase of buying and selling in response to the rate gap and hedging costs.
A trillion dollars is not about to be dumped, but every reason to sell is now in place, and the moment foreign bonds and foreign equities turn to net selling in the same week is the point where oscillation becomes trend.
Full access requires 🥉 Bronze tier
Sign in with Google — your tier will be checked automatically and access granted if eligible.
This site runs on ads — the tier system rewards community contributions.
Comments
This report is provided for informational purposes only and does not constitute a recommendation to buy or sell any financial instrument. Investment decisions should be made based on your own judgment and responsibility. The analysis and opinions contained herein are based on information available at the time of writing and are subject to change.